

Question: Consider the situation of Example 17.2. The following data are taken on additional samples of size 5. Plot the X- and S-values on the X-
Consider the situation of Example 17.2. The following data are taken on additional samples of size 5. Plot the X- and S-values on the X- and S-charts that are produced by the data in the preliminary sample. Does the process appear to be in control? Explain why or whynot.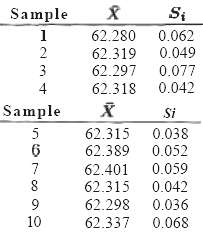
Si Sample 62.280 0.062 0.049 62.319 3 62.297 0.077 62.318 0.042 4 Sample Si 62.315 0.038 62.389 0.052 0.059 62.401 62.315 0.042 62.298 0.036 10 62.337 0.068
Step by Step Solution
3.46 Rating (166 Votes )
There are 3 Steps involved in it
6242 6240 6238 6238 6234 6232 6230 6228 6226 From Example 172 i... View full answer

Get step-by-step solutions from verified subject matter experts
Document Format (1 attachment)
18-M-S-Q-C-B-S (7).docx
120 KBs Word File