

Question: Consider the two systems shown in figure(a) Sketch the spectra of the various signals if xa(t) has the Fourier transform shown in figure(b) and Fs
Consider the two systems shown in figure(a) Sketch the spectra of the various signals if xa(t) has the Fourier transform shown in figure(b) and Fs = 2B. How are y1(t) and y2(t) related to xa(t)?(b) Determine y1(t) and y2(t) if xa(t) = cos2?F0t, F0 = 20 Hz, and Fs = 50 Hz or Fs = 30 Hz.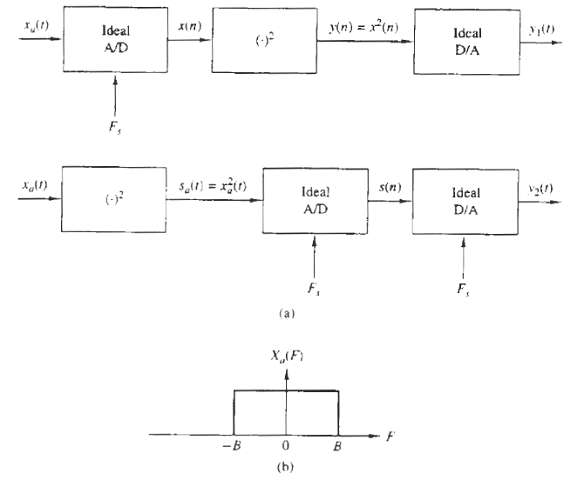
y(n) = x*(n) Xin) Ideal Idcal A/D D/A F, s,1) = r) s(n) Idea! Ideal (- A/D D/A F, (a) X(F) -B (b)
Step by Step Solution
3.50 Rating (173 Votes )
There are 3 Steps involved in it
a xn X x2n X X The output y 1 t is basically the square of the inp... View full answer

Get step-by-step solutions from verified subject matter experts
Document Format (1 attachment)
31-E-T-E-D-S-P (896).docx
120 KBs Word File