

Question: Construct a scatter plot of the data. Show y and x on the graph. Use the figure shown below. Keeping cars longer The median age
Construct a scatter plot of the data. Show y̅ and x̅ on the graph.
Use the figure shown below.
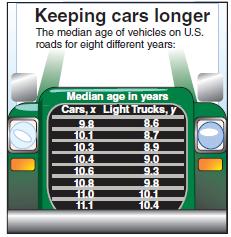
Keeping cars longer The median age of vehicles on U.S. roads for eight different years Median age in years Cars, x Light Trucks 14 104 9.0
Step by Step Solution
★★★★★
3.43 Rating (162 Votes )
There are 3 Steps involved in it
1 Expert Approved Answer
Step: 1 Unlock

Light tru... View full answer
Question Has Been Solved by an Expert!
Get step-by-step solutions from verified subject matter experts
Step: 2 Unlock
Step: 3 Unlock
Document Format (1 attachment)
598-M-S-L-R (5484).docx
120 KBs Word File