

Question: Data set: Ratings from 1 (lowest) to 10 (highest) provided by 24 people after taste-testing a new soft drink flavor Construct a frequency distribution and
Data set: Ratings from 1 (lowest) to 10 (highest) provided by 24 people after taste-testing a new soft drink flavor
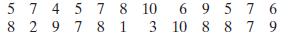
Construct a frequency distribution and a relative frequency histogram for the data set using five classes. Which class has the greatest relative frequency and which has the least relative frequency?
5 7 4 5 7 8 10 6 9 5 7 6 8 2 9 7813 10 887 9
Step by Step Solution
★★★★★
3.46 Rating (166 Votes )
There are 3 Steps involved in it
1 Expert Approved Answer
Step: 1 Unlock

Class width Range Number of classes 10 15 18 2 Class 12 34 56 78 910 Freque... View full answer
Question Has Been Solved by an Expert!
Get step-by-step solutions from verified subject matter experts
Step: 2 Unlock
Step: 3 Unlock
Document Format (1 attachment)
598-M-S-P (4509).docx
120 KBs Word File