

Question: Distribution Solutions, Inc., (DSI) is a regional distributor providing logistical support for merchandisers over a tristate area. Its distribution centers have been profitable until recently.
Distribution Solutions, Inc., (DSI) is a regional distributor providing logistical support for merchandisers over a tristate area. Its distribution centers have been profitable until recently. DSI provides logistics solutions in industries such as fashion apparel, electronics, housewares, building materials, automotive tools, and beverages. Its locations are convenient to major ports and transportation hubs. DSI has an outstanding reputation for customer service.
Profit margins have declined over the past several years due mostly to a weak regional economy and competition from larger merchandisers such as Home Depot, Lowe’s, and Wal-Mart who use logistic services of larger national distributors. Thus, the market share of merchandisers has declined along with their need for logistics support from DSI.
DSI orders supplies from a variety of manufacturers. All goods processed through the warehouse are stored on pallets and are handled by forklifts driven by forklift operators, who are assisted by warehouse labor. Processing of product consists of unloading at the receiving area (receiving activity), moving to the warehouse storage (put away activity), moving/shifting within the warehouse (warehousing activity), removal from racks (picking activity), and repacking (repacking activity).
Customer-specific processing consists of order taking, customer service, order changes, returns, scheduling (regular or expedited), and shipping.
Prices at DSI are set using a cost-plus formula based on the average cost per case delivered during the previous year. Two markups are used. The first markup covers the cost of warehousing and distribution. The second markup covers the costs of general and selling expenses and an allowance for profit. Currently (2013) this price is $7.25 per case. However, with the various discounts and promotions, this year’s actual price averages $4.75 per case for all products. DSI has six distinct product groups:
1. Regular products are prepackaged arriving and leaving in cases.
2. Fragile products are prepackaged but require care in handling.
3. Bulk products arrive in loose lots in crates or cases and are repackaged in smaller boxes, polybags, or small cartons before packing in cases.
4. High-security products must be locked in high-security area.
5. Short shelf-life products are dated products.
6. Singles are received in bundles and will be unbundled and hand-stacked for storage.
Traditionally, the regular prepackaged product has generated both high margins and high volume.
Fragile pre-packaged product has high margin but low volume. Bulk products and singles have poor margins but have been part of DSI’s offerings because of customer demands for a full-line distributor.
As DSI focused on increasing sales, mega stores and local small stores have increased their purchases of bulk products and singles. Until now, no premium has been charged for these products.
DSI has for many years classified its customer base into various types. Prior to 2008, almost all its customers were mega stores or large local stores. Since 2008, local small store and specialty store business has been aggressively pursued. The customer types can be described as follows:
● Mega stores (CT1): a few very large stores that order large volumes of all product types (7,680,000 cases annually)
● Local small stores (CT2): many stores that order low volumes of all products for each store (6,000,000 cases annually)
● Local large stores (CT3): many stores that order large volumes of only regular, fragile, and bulk products (14,400,000 cases annually)
● Specialty stores (CT4): a few stores that order low volumes of only regular, high-security, and short shelf-life products (600,000 cases annually)
Over the past several months, Paul Doxey, controller, working closely with Jane Stratford, chief marketing officer, and a cross-functional implementation team have been developing the ABC system to include all costs as well as customer profitability. A study has been conducted to determine the key drivers of work associated with the various customer types. These drivers include order frequency, order size, pallets ordered, customer-specific service, and order changes. Key activities associated with serving customers include the following:
● Shipping
● Parcel delivery
● Truck delivery
● Customer support
● Regular scheduling
● Expedited scheduling
● Order processing
● Order changes
● Corporate support
The implementation team headed by Paul Doxey has completed the activity analysis interviews, prepared a process map, collected data, and validated the new model both operationally and financially. The new process map is shown in Exhibit 12-24. In order to link the product and customer models the product mix for each customer is specified giving the gross profit for each customer.
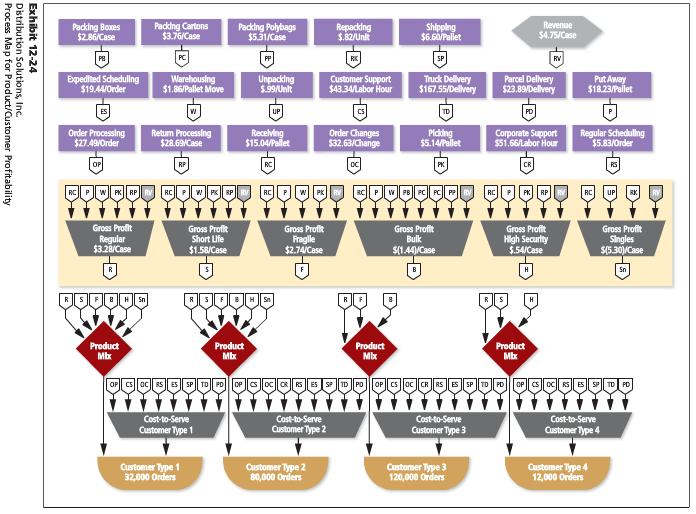
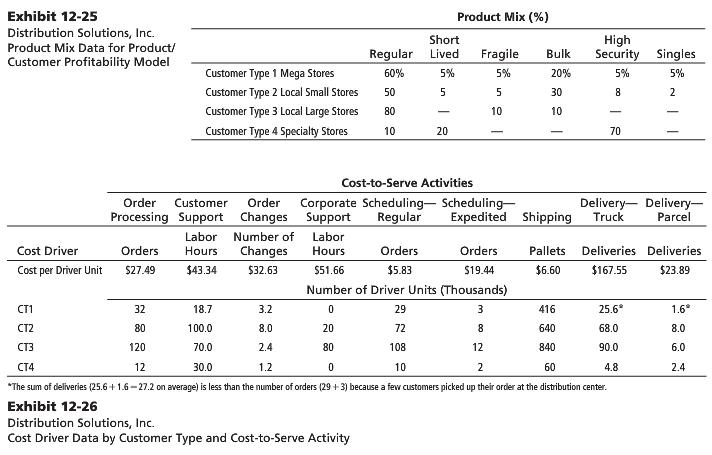
Exhibit 12-25 shows the product mix for each of the four customer types. Exhibit 12-26 shows the cost-to-serve data for each driver.
1. Using Excel, construct an exhibit that calculates customer gross margin percentage and customer cost-to-serve percentage for the four customer types. Plot these points along with one for customer type 2 on a graph similar to Exhibit 12-20 on page 506.
2. For each customer type, recommend a strategy to improve profitability.
Paddng Booxes Paddng Catons Paddng Polybags $531/Case $.82/Unlt $4 75/Case Dxpedited Scheduling Warehousing $1,86/Pallet More Unpaddng Truck Delivery Parcel Delhvery Put Away $1823/Pallet $19.44/0rder $43.34Labor Hour167.55/Dellvey Order Processing 27 49Order Return Processing Order Changes 32.63/Change Corporate Support Regular Scheduling $51.66/Labor Hour $15.04/Pallet 5.14/Palle Gross Proilt Gross Proft hort LUfe $1.58/Case Gross Proft Gross Prof Gross Profit High Seaurlty $.54/Case Gross Prof Singles $5.30 Case $2.74/Case $(1.44 Case Mtx Cost-to-Serve Customer Type 1 Cost-to-Serve Customer Type 2 Cost-to-Serve Customer Type 4 Customer Type 3 Customer Type 1 32000 Orders Customer Type 2 80,000 Oner Customer Type 3 120,000 Orders Custorser Type 12,000 Onders Exhibit 12-25 Distribution Solutions, Inc. Product Mix Data for Product/ Customer Profitability Model Product Mix (%) Short High Regular Lived Fragile Blk Scty Singles Customer Type 1 Mega Stores Customer Type 2 Local Small Stores 50 Customer Type 3 Local Large Sres 80 Customer Type 4 Specialty Stores 60% 5% 5% 20% 5% 5% 30 10 20 70 Cost-to-Serve Activities Order Customer Order Corporate Scheduling Scheduling- Processing Support Changes Support Reguar Expedited Shipping Truck Delivery Delivery- Parcel Labor Number of Labor Orders Changes Hours S51.66 Cost Driver Orders Orders Pallets Deliveries Deliveries Cost per Driver Unit 527.49 $43.34 $32.63 $5.83 S19.44 $6.60 $167.55 $23.89 Number of Driver Units (Thousands) 18.7 100.0 70.0 30.0 3.2 CT1 CT2 CT3 CT4 32 80 120 29 72 108 10 416 640 840 25.6 68.0 90.0 4.8 1.6 8.0 6.0 2.4 8.0 20 80 1.2 The sum of deliveries (25.6+16-27.2 on average) is less than the number of orders 1293) because a few customers picked up their order at the distribution center. Exhibit 12-26 Distribution Solutions, Inc. Cost Driver Data by Customer Type and Cost-to-Serve Activity
Step by Step Solution
3.27 Rating (159 Votes )
There are 3 Steps involved in it
1 Exhibits 1251A and 1251B show the calculation of customer gross margin percentage and customer costtoserve percentage for the 4 customer types Exhibit 1251C shows a plot of customer gross margin per... View full answer

Get step-by-step solutions from verified subject matter experts
Document Format (1 attachment)
345-B-C-A-P-C (142).docx
120 KBs Word File