

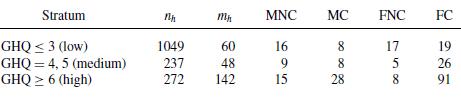
Question: Dunn et al. (1999) also classified the phase II sample by gender. In the following table, the entries in columns 37 are the counts from
Dunn et al. (1999) also classified the phase II sample by gender. In the following table, the entries in columns 3–7 are the counts from the phase II sample in the categories:
Male Non-Case (MNC), Male Case (MC), Female Non-Case (FNC), and Female Case (FC).
a. Estimate the percentages of persons in each cell of a 2×2 contingency table classified by gender and case/non-case. Find the standard error of each entry in the table.
b. Find the design effect for each cell proportion Ṕij and marginal proportion (Ṕi+ and Ṕ+j) in the table.
c. Use the Rao–Scott method (Section 10.3.2) to test H0 : pij = pi+p+j .
Stratum m MNC MC FNC FC nlg ln 1049 237 8 17 19 5 26 8 91 60 16 GHQ s 3 (low) GHQ = 4, 5 (medium) GHQ 2 6 (high) 48 272 42 5 28 28
Step by Step Solution
3.36 Rating (159 Votes )
There are 3 Steps involved in it
a We use the final weights for the phase 2 sample to calculate the proportions in the table and use ... View full answer

Get step-by-step solutions from verified subject matter experts
Document Format (1 attachment)
627-M-S-S-D (2908).docx
120 KBs Word File