

Question: Enterprise.com conducted a study of tech startup companies over the past five years, classifying the companies as highly successful, moderately successful, and unsuccessful. In the
Enterprise.com conducted a study of tech startup companies over the past five years, classifying the companies as “highly successful,” “moderately successful,” and “unsuccessful.” In the study, a sample of 10 startups in each category was selected. In each case, the aggregate years of business experience for the founders of the startup were determine d. Sample results are reported in the partially completed table below:
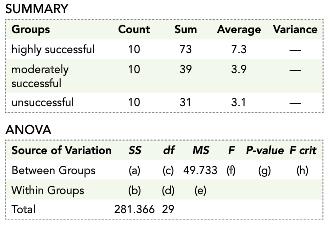
Fill in the values for the indicated cells. Can the results of the study be used to reject a “no difference in population mean years of business experience” null hypothesis at the 5% significance level? Explain.
SUMMARY Groups highly successul10 moderately Count Sum Average Variance 7.3 3.9 73 10 39 unsuccessful 31 ANOVA Source of Variation SS df MS F P-value F crit Between Groups (a) 49.733 (g)(h) Within Groups Total 281.366 29
Step by Step Solution
3.36 Rating (162 Votes )
There are 3 Steps involved in it
Start by filling in degrees of freedom c 3 1 2 d 10 10 10 3 27 Next calculat... View full answer

Get step-by-step solutions from verified subject matter experts
Document Format (1 attachment)
486-M-S-V-A (747).docx
120 KBs Word File