

Question: Figure shows the continuous cooling transformation diagram for a 1.13 wt% C iron-carbon alloy. Make a copy of this figure and then sketch and label
Figure shows the continuous cooling transformation diagram for a 1.13 wt% C iron-carbon alloy. Make a copy of this figure and then sketch and label continuous cooling curves to yield the following microstructures:
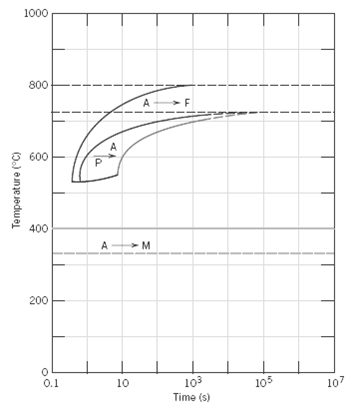
(a) Fine pearlite and proeutectoid cementite
(b) Martensite
(c) Martensite and proeutectoid cementite
(d) Coarse pearlite and proeutectoid cementite
(e) Martensite, fine pearlite, and proeutectoid cementite
1000 800 A 600 400 200 0.1 10 103 Time (s) 105 107 Temperature (C)
Step by Step Solution
3.38 Rating (167 Votes )
There are 3 Steps involved in it
Below is shown a continuous cooling transformation diagram for a 113 wt C ironcarbon al... View full answer

Get step-by-step solutions from verified subject matter experts
Document Format (1 attachment)
33-E-M-S-E-M-S (395).docx
120 KBs Word File