

Figure shows the spectrogram of a chirp signal of the form? x[n] = sin (? 0 n
Question:
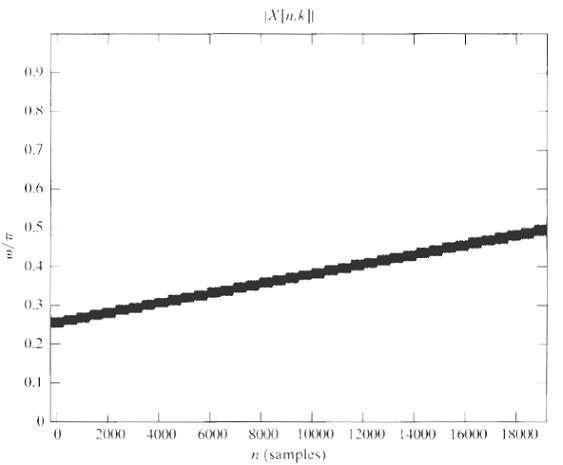
Figure shows the spectrogram of a chirp signal of the form?
x[n] = sin (?0n + 1/2?n2).
Note that the spectrogram is a representation of the magnitude of X[n, k], as defined in Eq. (??), where the dark regions indicate large values of |X[n, k]|. Based on the figure, estimate ?0 and ?.
Fantastic news! We've Found the answer you've been seeking!
Step by Step Answer:

Answered By
Muhammad Rehan
Enjoy testing and can find bugs easily and help improve the product quality.
10+ Reviews
10+ Question Solved
Related Book For 
Discrete Time Signal Processing
ISBN: 978-0137549207
2nd Edition
Authors: Alan V. Oppenheim, Rolan W. Schafer
Question Posted:
