

Question: Following is tabulated data that were gathered from a series of Charpy impact tests on a tempered 4140 steel alloy. (a) Plot the data as
Following is tabulated data that were gathered from a series of Charpy impact tests on a tempered 4140 steel alloy.
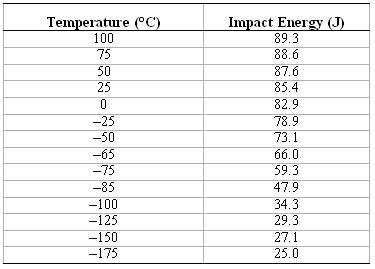
(a) Plot the data as impact energy versus temperature.
(b) Determine a ductile-to-brittle transition temperature as that temperature corresponding to the average of the maximum and minimum impact energies.
(c) Determine a ductile-to-brittle transition temperature as that temperature at which the impact energy is 70 J.
Impact Energy (J) Temperature (C) 100 75 89.3 88.6 50 87.6 85.4 82.9 25 -25 -50 78.9 73.1 66.0 59.3 47.9 -65 -75 -85 -100 34.3 29.3 -125 -150 27.1 -175 25.0
Step by Step Solution
3.43 Rating (162 Votes )
There are 3 Steps involved in it
a The plot of impact energy versus temperature is ... View full answer

Get step-by-step solutions from verified subject matter experts
Document Format (1 attachment)
33-E-M-S-E-M-S (280).docx
120 KBs Word File