

Question: For the punter data in Example 12.13, an additional response, punting distance, was also recorded. The following are average distance values for each of the
For the punter data in Example 12.13, an additional response, "punting distance," was also recorded. The following are average distance values for each of the 13 punters:
(a) Using the distance data rather than the hang times, estimate a multiple linear regression model of the type μ Y׀x1, x2, x3, x4, x5 = 00 + β l xl + β2x2 + β3x3 + β4x4 + β5x5 for predicting punting distance.
(b) Use stepwise regression with a significance level of 0.10 to select a combination of variables. 13
(c) Generate values for s2, R2, PRESS, and Σ13r=1׀δi׀ for the entire set of 31 models. Use this information to determine the best combination of variables for predicting punting distance.
(d) For the final model you choose plot the standardized residuals against. Y and do a normal probability plot of the ordinary residuals. Comment
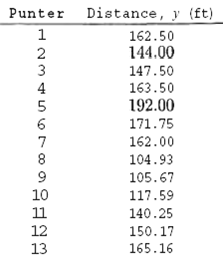
Distance, y (ft) Punter 162.50 144.00 2 3 147.50 163.50 192.00 171.75 162.00 104.93 105.67 117.59 11 140.25 12 150.17 13 165.16
Step by Step Solution
3.45 Rating (174 Votes )
There are 3 Steps involved in it
a 2959244 027872x1 006967x2 124195x3039554x4 022365x5 b The variables 3 and 5 were entered consecuti... View full answer

Get step-by-step solutions from verified subject matter experts
Document Format (1 attachment)
18-M-S-L-R (272).docx
120 KBs Word File