

Question: Frequency response data for a process are tabulated below. These results were obtained by introducing a sinusoidal change in the controller output (under manual control)
Frequency response data for a process are tabulated below. These results were obtained by introducing a sinusoidal change in the controller output (under manual control) and recording the measured response of the controlled variable. This procedure was repeated for various frequencies.
(a) If the PT controller is adjusted so that ?1 = 0.4 mm, what value of K will result in a phase margin of 45??
(b) If the controller settings in part (a) are used, what is the gain margin?
(c) If the Ziegler-Nichols settings for a PT controller are used, estimate MT. the maximum amplitude ratio for the complementary sensitivity function T(s).
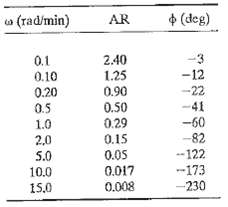
+ (deg) a (rad/min) AR -3 0.1 0.10 0.20 2.40 1.25 -12 -22 -41 -60 0.90 0.50 0.5 0.29 1.0 --82 0.15 2,0 0.05 0.017 0.008 --122 5.0 -173 10.0 -230 15.0
Step by Step Solution
3.29 Rating (175 Votes )
There are 3 Steps involved in it
a For a PI controller the G c and G c from Eqs 1362 and 1363 need to be included in the AR and g... View full answer

Get step-by-step solutions from verified subject matter experts
Document Format (1 attachment)
38-E-C-E-P-C (216).docx
120 KBs Word File