

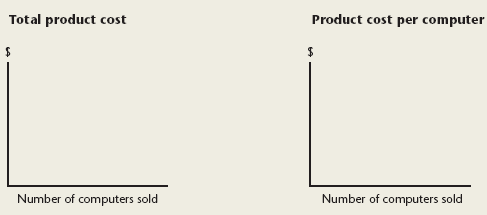
Question: Graphing variable cost behavior Dubovsky Computers purchases computers from a manufacturer for $500 per computer. The following graph setups depict product cost on the vertical
Graphing variable cost behavior Dubovsky Computers purchases computers from a manufacturer for $500 per computer. The following graph setups depict product cost on the vertical axes and activity level on the horizontal axes:
.:.
Required
a. Draw a line that depicts the relationship between total product cost and the number of computers sold.
b. Draw a line that depicts the relationship between cost per computer and the number of computers sold.
Total product cost Product cost per computer Number of computers sold Number of computers sold
Step by Step Solution
3.41 Rating (176 Votes )
There are 3 Steps involved in it
a Total produc... View full answer

Get step-by-step solutions from verified subject matter experts
Document Format (1 attachment)
67-B-M-A-C-B (199).docx
120 KBs Word File