

Question: Heres some additional information about the pizza sales data presented in Exercise 57. It is generally thought that sales spike during the weeks leading up
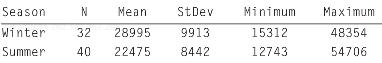
Here€™s some additional information about the pizza sales data presented in Exercise 57. It is generally thought that sales spike during the weeks leading up to AFC and NFC football championship games, as well as leading up to the Super Bowl at the end of January each year. If we omit those 6 weeks of sales from this three-year period of weekly sales, the summary statistics look like this.
Do sales appear to be higher during the winter months after omitting those weeks most influenced by football championship games?
a) Write the null and alternative hypotheses.
b) Test the null hypotheses and state your conclusion.
c) Suggest additional factors that may influence pizza sales not accounted for in this exercise.
Season N Mean StDev Minimum Maximum Winter32 28995 9913 Summer 422475 8442 15312 12743 48354 54706
Step by Step Solution
3.41 Rating (173 Votes )
There are 3 Steps involved in it
a The hypotheses are H 0 W S 0 H A W S 0 b From technology or manual calculation t 29... View full answer

Get step-by-step solutions from verified subject matter experts
Document Format (1 attachment)
452-M-C-M-S (96).docx
120 KBs Word File