

In an environmental engineering study of a certain chemical reaction, the concentrations of 18 separately prepared solutions
Question:
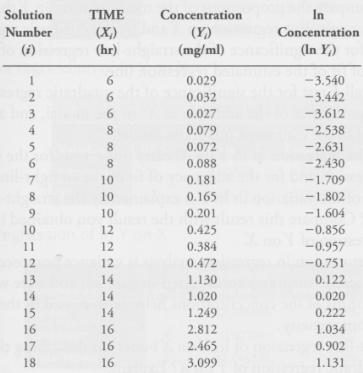
In an environmental engineering study of a certain chemical reaction, the concentrations of 18 separately prepared solutions were recorded at different times (three measurements at each of six times). The natural logarithms of the concentrations were also computed. The data recorded are reproduced in the following table:
a. Plot on separate sheets of graph paper:
(1) Concentration (Y) versus time (X).
(2) Natural logarithm of concentration (In Y) versus time (X).
b. Using the accompanying computer output, obtain the following:
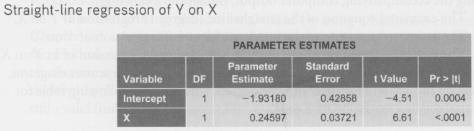
(1) The estimated equation of the straight-line (degree 1) regression of Y on X.
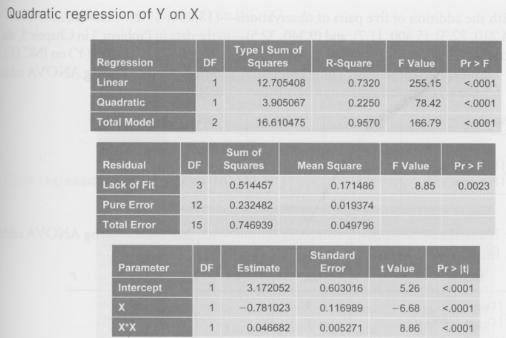
(2) The estimated equation of the quadratic (degree 2) regression of Y on X.
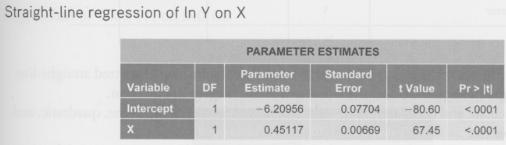
(3) The estimated equation of the straight-line (degree 1) regression of In Y on X.
(4) Graphs of each of these fitted equations on their respective scatter diagrams.
c. Based on the accompanying computer output, complete the following table for the straight-line regression of Y on X.
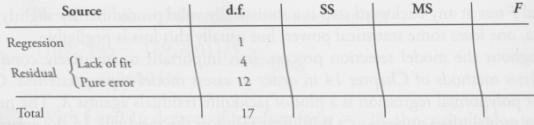
d. Based on the accompanying computer output, complete the following ANOVA table.
e. Determine and compare the proportions of the total variation in Y that are explained by the straight-line regression on X and by the quadratic regression on X
f. Carry out F tests for the significance of the straight-line regression of Y on X and for the adequacy of fit of the estimated regression line.
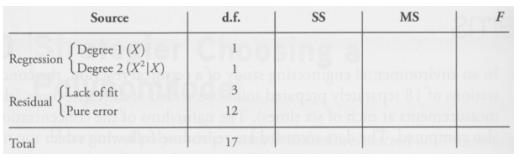
g. Carry out an overall F test for the significance of the quadratic regression of Y on X, a test for the significance of the addition of X2 to the model, and an F test for the adequacy of fit of the estimated quadratic model.
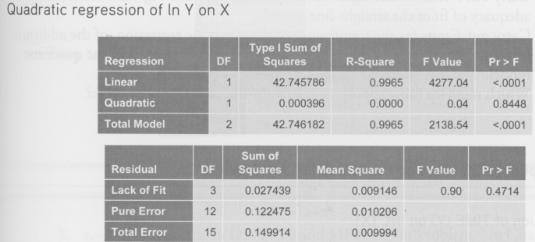
h. For the straight-line regression of In Y on X, carry out F tests for the significance of the overall regression and for the adequacy of fit of the straight-line model.
i. What proportion of the variation in In Y is explained by the straight-line regression of In Y on X? Compare this result with the result you obtained in part (e) for the quadratic regression of Y on X.
j. A fundamental assumption in regression analysis is variance homoscedasticity.
(1) Examine the scatter diagrams constructed in part (a), and state why taking natural logarithms of the concentrations helps with regard to the assumption of variance homogeneity.
(2) Is the straight-line regression of In Y on X better for describing this set of data than the quadratic regression of Y on X? Explain.
k. What key assumption about the data would be in question if, instead of 18 different solutions, there were only 3 different solutions, each of which was analyzed at the six different time points?
Straight-line regression of Y on X
Quadratic regression of Y on X
Straight-line regression of ln Y on X
Quadratic regression of ln Y on X
Step by Step Answer:
a Plots of Y vs X and lnY vs X are shown below The least squares line and the least squares parabola are also shown i ii b From the computer output we find 1 Degree 1 1932 0246X 2 Degree 2 3172 0781X ...View the full answer


Applied Regression Analysis and Other Multivariable Methods
ISBN: 978-1285051086
5th edition
Authors: David G. Kleinbaum, Lawrence L. Kupper, Azhar Nizam, Eli S. Rosenberg
