

In Figure, the logarithm of E r (t) versus the logarithm of time is plotted for polyisobutylene
Question:
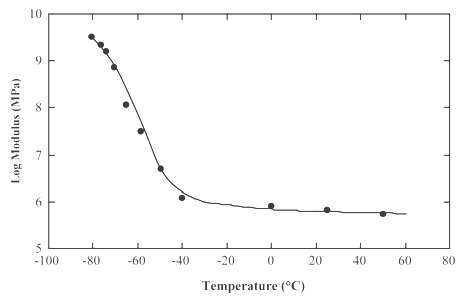
In Figure, the logarithm of Er(t) versus the logarithm of time is plotted for polyisobutylene at a variety of temperatures. Make a plot of Er(10) versus temperature and then estimate its Tg.
Fantastic news! We've Found the answer you've been seeking!
Step by Step Answer:
Below is plotted the logarithm of E r 10 versus temperature ...View the full answer

Answered By
Evans Cherono
I am an Information Technology Graduate and willing to work on any computer science or IT work to ensure I do my best all the time.
2+ Reviews
10+ Question Solved
Related Book For 
Fundamentals of Materials Science and Engineering An Integrated Approach
ISBN: 978-1118061602
4th Edition
Authors: David G. Rethwisch
Question Posted:
