

Question: Interpreting profitability and risk ratios Scania is a Swedish company that manufactures trucks and other heavy vehicles and provides financing for its customers' purchases. Exhibit
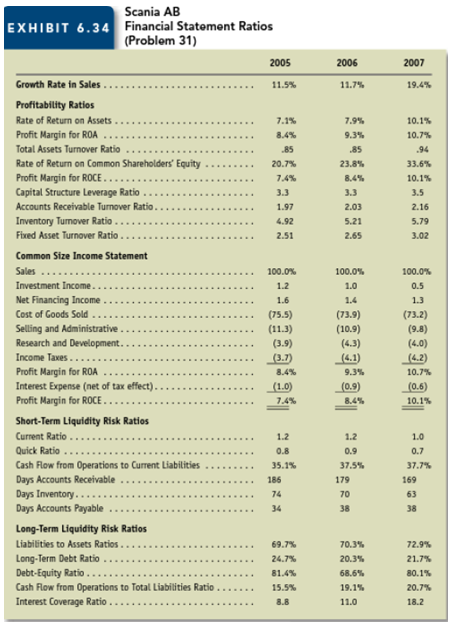
Interpreting profitability and risk ratios Scania is a Swedish company that manufactures trucks and other heavy vehicles and provides financing for its customers' purchases. Exhibit 6.34 presents financial statement ratios for Scania for 2005, 2006, and 2007.
The amount on the common-size income statement for Net Financing Income is the difference between interest earned on accounts receivable from customers and interest expense on amounts borrowed to finance those receivables as well as other direct cost of its financial services.
a. What are the likely reasons for the increase in the profit margin for ROA during the three-year period from 2005 to 2007?
b. What are the likely reasons for the decreasing cost of goods sold to sales percentage combined with the increasing inventory turnover ratio during the three-year period?
c. What are the likely reasons the increase in the fixed asset turnover between 2006 and 2007.
d. The total assets turnover remained at .85 between 2005 and 2006, yet the accounts receivable. Inventory, and fixed asset turnovers increased. What is the likely explanation for the stable total assets turnover?
e. What are the likely explanations for the increase in the two cash flow ratios between 2005 and 2006?
f. What are the likely reasons for the decrease in the current and quick ratios between 2006 and 2007?
g. Did financial leverage work to the advantage of the common shareholders in each year?Explain.
Scania AB Financial Statement Ratios (Problem 31) EXHIBIT 6.34 2006 2005 2007 Growth Rate in Sales. 11.7% 11.5% 19.4% Profitability Ratios Rate of Return on Assets . 7.1% 7.9% 10.1% Profit Margin for ROA Total Assets Turnover Ratio 10.7% 8.4% 9.3% 85 85 .94 Rate of Return on Common Shareholders' Equity 33.6% 20.7% 23.8% Profit Margin for ROCE .. 7.4% 8.4% 10.1% Capital Structure Leverage Ratio Accounts Receivable Turnover Ratio.. Inventory Tumover Ratio. 3.3 3.3 3.5 2.03 2.16 1.97 4.92 5.21 5.79 Fixed Asset Turnover Ratio 2.51 2.65 3.02 Common Size Income Statement Sales 100.0% 100.0% 100.0% Investment Income.. 1.2 1.0 0.5 Net Financing Income . 1.6 1.4 1.3 Cost of Goods Sold (75.5) (73.9) (73.2) Selling and Administrative Research and Development. (11.3) (10.9) (9.8) (3.9) (4.3) (4.0) Income Taxes... (3.7) _(4.1) (4.2) Profit Margin for ROA Interest Expense (net of tax effect). Profit Margin for ROCE. 8.4% 9.3% 10.7% (0.9) (1.0) (0.6) 7.4% 8.4% 10.1% Short-Term Liquidity Risk Ratios Current Ratio....... 1.2 1.2 1.0 Quick Ratio 0.8 0.9 0.7 Cash Flow from Operations to Current Liabilities Days Accounts Receivable Days Inventory.. Days Accounts Payable 35.1% 37.5% 37.7% 169 186 179 74 70 63 34 38 38 Long-Term Liquidity Risk Ratios Liabilities to Assets Ratios . 69.7% 70.3% 72.9% Long-Term Debt Ratio Debt-Equity Ratio ... Cash Flow from Operations to Total Liabilities Ratio Interest Coverage Ratio ... 24.7% 20.3% 21.7% 80.1% 81.4% 68.6% 15.5% 19.1% 20.7% 8.8 11.0 18.2
Step by Step Solution
3.33 Rating (174 Votes )
There are 3 Steps involved in it
Scania interpreting profitability and risk ratios a The increase in the profit margin for ROA results from decreases in the cost of goods sold to sales percentage and the selling and administrative ex... View full answer

Get step-by-step solutions from verified subject matter experts
Document Format (1 attachment)
65-B-A-F-S (714).docx
120 KBs Word File