

Question: Let x be a random variable representing percentage change in neighborhood population in the past few years, and let y be a random variable representing
Let x be a random variable representing percentage change in neighborhood population in the past few years, and let y be a random variable representing crime rate (crimes per 1000 population). A random sample of six Denver neighborhoods gave the following information (Source: Neighborhood Facts, The Piton Foundation).
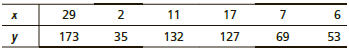
Σx = 72; Σy = 589; Σx2 = 1340; Σy2 = 72,277; Σxy = 9499
(a) Draw a scatter diagram for the data.
(b) Find x, y, b, and the equation of the least-squares line. Plot the line on the scatter diagram of part (a).
(c) Find the sample correlation coefficient r and the coefficient of determination. What percentage of the variation in y is explained by the least-squares model?
(d) Test the claim that the population correlation coefficient r is not zero at the 1% level of significance.
(e) For a neighborhood with x = 12% change in population in the past few years, predict the change in the crime rate (per 1000 residents).
(f) Verify that Se ≈ 22.5908.
(g) Find an 80% confidence interval for the change in crime rate when the percentage change in population is x = 12%.
(h) Test the claim that the slope b of the population least-squares line is not zero at the 1% level of significance.
(i) Find an 80% confidence interval for b and interpret its meaning.
29 2 17 2 2 6 173 35 132 127 69 53
Step by Step Solution
3.48 Rating (155 Votes )
There are 3 Steps involved in it
a b c r 2 0927 2 0859 This means that 859 of the variation in crime rate can be explained by the cor... View full answer

Get step-by-step solutions from verified subject matter experts
Document Format (1 attachment)
1275-M-S-P-E(1417).docx
120 KBs Word File