

Let x = day of observation and y = number of locusts per square meter during a
Question:
Let x = day of observation and y = number of locusts per square meter during a locust infestation in a region of North Africa.
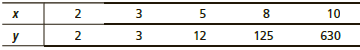
(a) Draw a scatter diagram of the (x, y) data pairs. Do you think a straight line will be a good t to these data? Do the y values almost seem to explode as time goes on?
(b) Now consider a transformation y' = log y. We are using common logarithms of base 10. Draw a scatter diagram of the (x, y') data pairs and compare this diagram with the diagram of part (a). Which graph appears to better t a straight line?
(c) Use a calculator with regression keys to find the linear regression equation for the data pairs 1x, yoe2. What is the correlation coefficient?
(d) The exponential growth model is y = αβx. Estimate a and b and write the exponential growth equation.
Step by Step Answer:
a These data are not described well by a straight line because the y values ...View the full answer


Understandable Statistics Concepts And Methods
ISBN: 9781337119917
12th Edition
Authors: Charles Henry Brase, Corrinne Pellillo Brase
