

Question: Listed below are the nicotine amounts (in mg per cigarette) for samples of filtered and non-filtered cigarettes. Do filters appear to be effective in reducing
Listed below are the nicotine amounts (in mg per cigarette) for samples of filtered and non-filtered cigarettes. Do filters appear to be effective in reducing the amount of nicotine?
a. Find the mean and median for each of the two data sets.
b. Find the range and standard deviation for each of the two data sets.
c. Give the five-number summary and construct a boxplot for each of the two data sets.
d. Apply the range rule of thumb to estimate the standard deviation of each of the two data sets. How well does the rule work in each case? Briefly discuss why it does or does not work well.
e. Based on all your results, compare and discuss the two data sets in terms of their center and variation. Does there appear to be a difference between the amounts of nicotine in non-filtered cigarettes and filtered cigarettes?
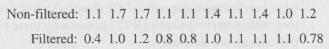
Non-filtered: 1.7 1.7 1.1 1. 14 1.1 14 1.0 1.2 Filtered: 0.4 1.0 1.2 0.8 08 1.0 1.I 1.1 1.1 0.78
Step by Step Solution
3.37 Rating (166 Votes )
There are 3 Steps involved in it
a Nonfiltered Using Excel Mean is 128 mg and median is 115 mg Filtered Mean is 09... View full answer

Get step-by-step solutions from verified subject matter experts
Document Format (1 attachment)
666-M-S-D-A (5635).docx
120 KBs Word File