

Matching graphs with descriptions of cost and revenue behavior. Given here are a number of graphs. The
Question:
Matching graphs with descriptions of cost and revenue behavior. Given here are a number of graphs.
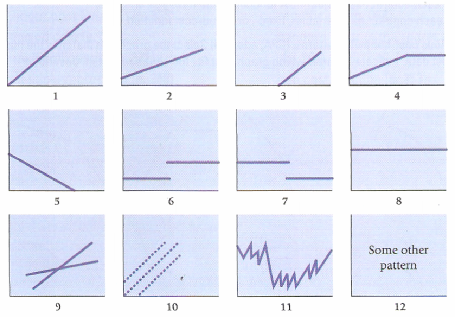
The horizontal axis represents the units produced over the year and the vertical axis represents total cost or revenues. Indicate by number which graph best fits the situation or item described. Some graphs may be used more than once; some may not apply to any of the situations.
a. Direct material costs
b. Supervisors’ salaries for one shift and two shifts
c. A cost-volume-profit graph
d. Mixed costs—for example, car rental fixed charge plus a rate per mile driven
e. Depreciation of plant computed on a straight-line basis
f. Data supporting the use of a variable-cost rate, such as manufacturing labor cost of $14 per unit produced
g. Incentive bonus plan that pays managers $0.10 for every unit produced above some level of production
h. Interest expense on $2 million borrowed at a fixed rate of interest
Step by Step Answer:
Matching graphs with descriptions of cost and revenue behavior a 1 b 6 A stepcos...View the full answer


Cost Accounting A Managerial Emphasis
ISBN: 978-0136126638
13th Edition
Authors: Charles T. Horngren, Srikant M.Dater, George Foster, Madhav
