

Question: Modify the influence diagram in Figure 3.11 (the hurricane-forecast example) so that it contains nodes for each of the two objectives (maximize safety and minimize
Modify the influence diagram in Figure 3.11 (the hurricane-forecast example) so that it contains nodes for each of the two objectives (maximize safety and minimize cost). Cost has a natural attribute scale, but how can you define safety? Construct an attribute scale that you could use to measure the degree of danger you might encounter during a hurricane.
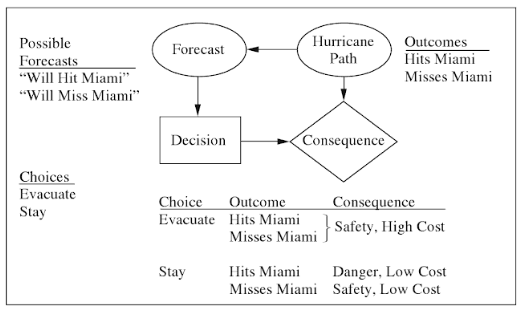
Hurricane Outcomes Possible Forecast Hits Miami Path Forecasts "Will Hit Miami" Misses Miami "Will Miss Miami" Consequence Decision Choices Evacuate Choice Outcome Consequence Stay Evacuate Hits Miami Safety, High Cost Misses Miami Danger, Low Cost Misses Miami Safety, Low Cost Stay Hits Miami
Step by Step Solution
3.52 Rating (159 Votes )
There are 3 Steps involved in it
Note that Evacuation Cost is high or low depending only on the evacuation decision Thus there is no arc from Hurricane Path to Evacuation Cost This in... View full answer

Get step-by-step solutions from verified subject matter experts
Document Format (1 attachment)
668-M-S-S-M (921).docx
120 KBs Word File