

Question: Name the following chart, and identify the items represented by the letters (a) through(f). Sales and Costs $200,000 $150,000 $100,000 $50,000 10,000 20,000 30,000 40,000
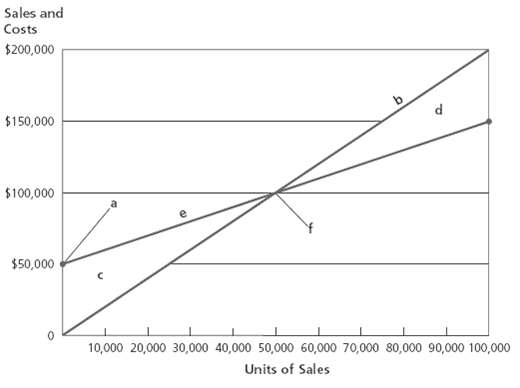
Name the following chart, and identify the items represented by the letters (a) through(f).
Sales and Costs $200,000 $150,000 $100,000 $50,000 10,000 20,000 30,000 40,000 50,000 60,000 70,000 80,000 90,000 100,000 Units of Sales
Step by Step Solution
★★★★★
3.43 Rating (181 Votes )
There are 3 Steps involved in it
1 Expert Approved Answer
Step: 1 Unlock

a Fixed costs b Total ... View full answer
Question Has Been Solved by an Expert!
Get step-by-step solutions from verified subject matter experts
Step: 2 Unlock
Step: 3 Unlock
Document Format (1 attachment)
46-B-M-A-C-V-P (49).docx
120 KBs Word File