

Question: On January 1, 2011, Devco acquired cum div. all the shares of Brooke, at which date the equity and liability sections of Brookes statement of
On January 1, 2011, Devco acquired cum div. all the shares of Brooke, at which date the equity and liability sections of Brooke’s statement of financial position showed the following balances:
Share capital (300,000 shares)………………….. $300,000
Retained earnings ……………………………… 40,000
Other components of equity……………………. 30,000
Dividend payable……………………………….. 20,000
The dividend payable was subsequently paid in February 2011.
On January 1, 2011, all the identifiable assets and liabilities of Brooke were recorded at fair value except for:
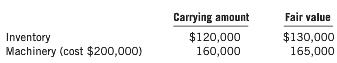
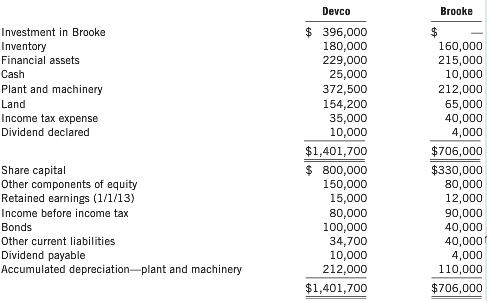
The inventory was all sold by October 2011. The machinery had a further five-year life but was sold on June 30, 2013. At the acquisition date, Brooke had a contingent liability of $20,000 that Devco considered to have a fair value of $12,000. This liability was settled in December 2011. At January 1, 2011, Brooke had not recorded any goodwill. On December 31, 2013, the trial balances of Devco and Brooke were as follows:
Additional information:
1. On January 1, 2012, Devco sold an item of plant to Brooke at a profit before tax of $4,000. Devco depreciates this particular item of plant straight line over 5 years and Brooke depreciates straight line over 10 years.
2. At December 31, 2013, Devco had on hand some items of inventory purchased from Brooke in June 2013 at a profit of $500.
3. Devco charged a management fee of $2,000 per month to Brooke. As of year end, Brooke had not paid the fee for three months.
4. The tax rate is 30%.
Required
(a) Prepare the consolidated statement of comprehensive income, consolidated statement of changes in equity, and the consolidated statement of financial position at December 31, 2013.
(b) In relation to part (1) in the additional information, explain why you made the consolidated financial statement adjustments at December 31, 2013.
Carrying amount $120,000 160,000 Fair value Inventory Machinery (cost $200,000) $130,000 165,000 Devco Brooke Investment in Brooke Inventory Financial assets Cash Plant and machinery Land Income tax expense Dividend declared $396,000 180,000 229,000 25,000 372,500 154,200 35,000 10,000 160,000 215,000 10,000 212,000 65,000 40,000 4,000 $706,000 $330,000 80,000 12,000 90,000 40,000 40,000 4,000 110,000 $706,000 $1,401,700 Share capital Other components of equity Retained earnings (1/1/13) Income before income tax Bonds Other current liabilities Dividend payable Accumulated depreciation-plant and machinery $800,000 150,000 15,000 80,000 100,000 34,700 10,000 212,000 $1,401,700 JUPITER INC. &EUROPA LTD. Statements of Income and Retained Earning:s year ended December 31, 2013 upiter Europa Sales Investment income $12,280,000 240,000 $7,370,000 12,000 7,382,000 12,520,000 Cost and expenses Cost of goods sold Depreciation and amortization expense Interest expense Other expenses Income tax expense 7,859,000 531,000 212,000 793,000 1,250,000 10,645,000 1,875,000 1,722,000 3,597,000 625,000 $ 2,972,000 5,159,000 350,000 152,000 356,000 546,000 6,563,000 819,000 1,300,000 2,119,000 240,000 $1,879,000 Net income Retained earnings, beginning of year Dividends Retained earnings, end of year JUPITER INC. &EUROPA LTD. Balance Sheets December 31, 2013 Jupiter Europa Assets Cash and receivables Inventory Investment in Europa Loan to Jupiter (non-current) Property, plant and equipment (net) 1,516,000 4,124,000 4,716,000 $976,000 2,850,000 4,716,000 $15,116,000 300,000 5,756,000 $9,882,000 Liabilities and shareholders' equity Current liabilities Long-term liabilities Common shares Retained earnings $2,844,000 5,300,000 4,000,000 2,972,000 $15,116,000 $1,203,000 3,800,000 3,000,000 1,879,000 $9,882,000 HIT PUC Sales and other income Less expenses Cost of goods sold Depreciation expense Income tax and other expenses Net income $28,800,000 $13,000,000 18,000,000 3,400,000 4,200,000 3,200,000 8,200,000 1,800,000 1,600,000 1,400,000 HIT $15,000,000 28,600,000 $43,600,000 PUC $ 8,800,000 17,400,000 $26,200,000 $13,800,000 Current assets Non-curent assets Total assets Liabilities Common Shares Retained Earnings Total liabilities and shareholders' equity $26,400,000 4,000,000 13,200,000 $43,600,000 2,000,000 10,400,000 $26,200,000 Sienna Danon $234,800 17,000 6,600 $190,000 Sales revenue Dividend revenue Other income 10,000 200,000 (120,000) (20,000) (140,000) 60,000 (20,000) 40,000 32,000 72,000 (9,800) (7,200) (17,000) $55,000 258,400 (123,000) (34,600) (157,600) 100,800 (32,000) Cost of sales Other expenses Profit before income tax Net income Profit for the year Retained earnings (1/1/13) Total available for appropriation Interim dividend paid Dividend declared 68,800 76,000 144,800 (34,000) (16,000) (50,000) 94,800 Retained earnings (31/12/13) Current assets Cash Receivables Allowance for doubtful accounts Financial assets Inventory Total current assets Non-current assets Plant and machinery Accumulated depreciation Land Bonds in Danon Investment in Danon Total non-current assets $1,000 27,000 (500) 20,000 48,000 95,500 40 12,100 (300) 10,000 47,000 68,840 70,000 (26,000) 190,000 100,000 (40,000) 99,300 60,000 160,000 379,300 474,800 234,000 302,840 Total assets Sienna Danon Current liabilities Dividend payable Provisions Bank overdraft Current tax liabilities 7,200 8,800 14,840 10,000 40,840 16,000 12,000 11,000 39,000 Total current liabilities Non-current liabilities 5% mortgage bonds Deferred tax liabilities 13,000 13,000 52,000 $422,800 80,000 5,000 85,000 125,840 $177,000 Total non-current liabilities Total iabilities Net assets Equity Share capital Retained earnings Other components of equity Total equity $320,000 94,800 8,000 $422,800 $120,000 55,000 2,000 $177,000 Coltron Tara $25,000 1,000 1,000 1,000 28,000 21,000 3,000 24,000 4,000 1,350 2,650 6,000 8,650 2,500 $23,600 Sales revenue Dividend revenue Other income Gain on sale of property, plant, and equipment Tota Cost of sales Other expenses Total expenses Profit before income tax Income tax expense Profit for the period Retained earnings (1/1/13) 2,000 2,000 27,600 18,000 1,000 19,000 8,600 1,950 6,650 3,000 9,650 1,000 $ 8,650 Dividend paid Retained earnings (31/12/13) 6,150 Jasmine Lessard $40,000 3,000 1,600 44,600 30,000 7,500 37,500 7,100 2,200 4,900 2,800 7,700 2,000 2,400 4,400 $3,300 $78,000 Revenue Gain on sale of office furniture Dividend revenue Total income Cost of sales Other expenses Total expenses Profit before income tax Income tax expense Profit for the year Retained earnings (1/1/13) 4,400 82,400 60,000 10,800 70,800 11,600 3,000 8,600 14,500 23,100 4,000 8,000 12,000 $11,100 Interim dividend paid Final dividend declared Retained earnings (31/12/13) Jasmine Lessard Retained earnings Share capital 39,500 50,000 6,800 40,000 Plant and equipment (cost $80,000) nventory Carrying amount F value $61,000 3,500 $60,000 3,000 Carrying amount Fair value Inventory Plant (cost $80,000) $10,000 50,000 $12,000 53,000 Abbots Evion $146,000 9,000 2,000 157,000 88,000 16,000 104,000 53,000 12,000 41,000 10,000 51,000 8,000 $43,000 $120,000 Sales Dividend revenue Gain on sale of non-current asset 120,000 68.000 19,000 87,000 33,000 14,000 19,000 10,000 29,000 9,000 $ 20,000 Cost of sales Other expenses Profit before income tax Income tax expense Profit for the year Retained earnings (1/4/13) Total available for appropriation Dividend paid Retained earnings (31/3/14) Trial Balances as at December 31, 2013 Lara ade Credits Share capital Retained earnings (1/1/13) Current tax liabilities Deferred tax liabilities Payables Sales revenue Other income $500,000 90,000 22,000 6,240 22,000 250,000 20,000 $910,240 $100,000 86,000 38,000 5,200 14,000 120,000 5,000 $368,200 Debits Income tax expense Dividend declared and paid Property, Plant, and Equipment -net Motor vehicles-net Receivables Financial assets Inventory Cash Deferred tax assets Investment in Jade Cost of sales Other expenses Loss on sale of property, plant, and equipment sold 20,000 10,000 125,000 124,200 25,000 60,000 106,440 46,900 12,700 160,000 188,000 28,000 4,000 $10,000 8.000 76,000 52,600 7,310 40,000 72,000 5,990 6,300 80,000 5,000 5,000 $368,200 910,240 Carrying amount Inventory Motor vehicles (cost $18,000) Furniture and fixtures (cost $30,000) Land $50,000 15,000 24,000 18,480 Fair value $56,000 16,000 32,000 24,480 Tilford Sifton Credits Share capital Retained earnings (1/1/13) Bonds Final dividend payable Current tax liabilities Other payables Advance from Tilford Sales revenue Other income Accumulated depreciation $170,000 57,000 120,000 10,000 8,000 34,800 $80,000 51,500 3,000 2,500 10,100 10,000 65,000 22,000 85,000 23,000 - Motor vehicles - Furniture and fixtures 4,000 2,000 $513,800 2,000 6,000 $252,100 Debits Cost of sales Other expenses Investment in Sifton Land Motor vehicles Furniture and fixtures Inventory Other assets Income tax expense Interim dividend paid Final dividend declared Deferred tax assets Advance to Sifton $65,000 22,000 137,200 53,500 27,000 28,000 34,000 171,580 8,620 7,200 4,000 10,000 16,200 10,000 $513,800 24,480 22,000 37,300 70,320 3,100 2,000 2,000 3,000 7,400 $252,100 Miran Winter $234,800 17,000 6,600 $190,000 Sales revenue Dividend revenue Other income 258,400 (123,000) (34,600) (157,600) 100,800 (32,000) 68,800 76,000 144,800 10,000 200,000 (120,000) (20,000) (140,000) 60,000 (20,000) 40,000 32,000 72,000 (9,800) (7,200) (17,000) $55,000 Cost of sales Other expenses Profit before income tax Income taxes Profit for the year Retained earnings (1/1/13) Total available for appropriation Interim dividend paid Dividend declared (34,000) (16,000) (50,000) 94,800 Retained earnings (31/12113) Current assets Cash Receivables Allowance for doubtful accounts Financial assets Inventory Total current assets $1,000 27,000 (500) 20,000 48,000 95,500 40 12,100 (300) 10,000 47,000 68,840 Non-current assets Plant and machinery Accumulated depreciation Land Bonds in Winter Investment in Winter 70,000 (26,000) 190,000 100,000 (40,000) 99,300 60,000 160,000 379,300 Total non-current assets 234,000 302,840 Total assets 474,800 Current liabilities Dividend payable Provisions Bank overdraft Current tax liabilities Total current liabilities Non-current liabilities 5% mortgage bonds Deferred tax liabilities Total non-current liabilities Total liabilities Net assets 16,000 12,000 11,000 39,000 7,200 8,800 14,840 10,000 40,840 13,000 13,000 52,000 $422,800 80,000 5,000 85,000 125,840 $177,000 Equity Share capital Retained earnings Other components of equity Total equit) $320,000 94,800 8,000 $422,800 $120,000 55,000 2,000 $177,000
Step by Step Solution
3.25 Rating (163 Votes )
There are 3 Steps involved in it
Consideration transferred 396000 Net fair value of identifiable assets and liabilities of Brooke 350000 300000 Share capital 40000 Retained earnings 30000 Other equity 20000 Dividend payable Fair valu... View full answer

Get step-by-step solutions from verified subject matter experts
Document Format (1 attachment)
469-B-A-C (797).docx
120 KBs Word File