

Question: Otto's Auto Sales asked for your help in comparing the company's profit performance and financial position with the average for the auto sales industry. The
Otto's Auto Sales asked for your help in comparing the company's profit performance and financial position with the average for the auto sales industry. The owner has given you the company's income statement and balance sheet as well as the industry average data for retailers of used autos.
Requirements
1. Prepare a two-column, common-size income statement and a two-column, common- size balance sheet for Otto’s Auto Sales. The first column of each statement should present Otto’s Auto Sales’ common-size statement and the second column should show the industry averages.
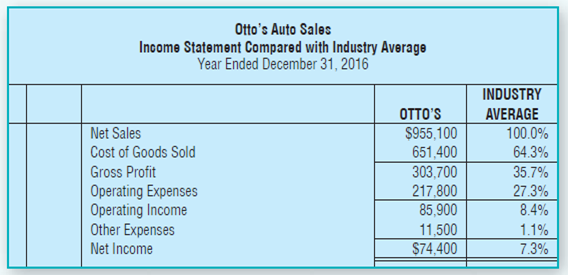
2. For the profitability analysis, examine Otto’s Auto Sales’ (a) ratio of gross profit to net sales, (b) ratio of operating income to net sales, and (c) ratio of net income to net sales. Compare these figures with the industry averages. Is Otto’s profit performance better or worse than the industry average?
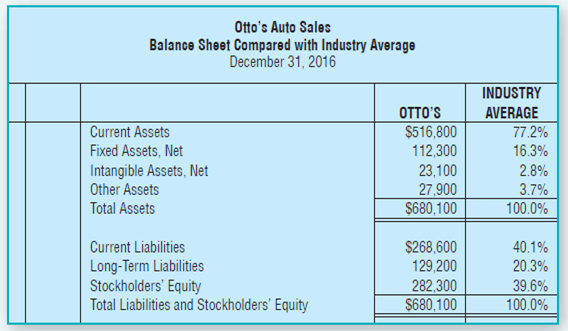
3. For the analysis of financial position, examine Otto’s Auto Sales’ (a) ratio of current assets to total assets, and (b) ratio of stockholders’ equity to total assets. Compare these ratios with the industry averages. Is Otto’s Auto Sales’ financial position better or worse than the industry average?
Otto's Auto Sales Income Statement Compared with Industry Average Year Ended December 31, 2016 INDUSTRY OTTO'S $955,100 651,400 303,700 AVERAGE Net Sales 100.0% 64.3% Cost of Goods Sold Gross Profit 35.7% 27.3% 8.4% Operating Expenses Operating Income Other Expenses Net Income 217,800 85,900 11,500 $74,400 1.1% 7.3% Otto's Auto Sales Balance Sheet Compared with Industry Average December 31, 2016 INDUSTRY OTTO'S AVERAGE 77.2% Current Assets $516,800 112,300 Fixed Assets, Net Intangible Assets, Net Other Assets 16.3% 23,100 27,900 $680,100 2.8% 3.7% Total Assets 100.0% Current Liabilities $268,600 40.1% Long-Term Liabilities Stockholders' Equity Total Liabilities and Stockholders' Equity 129,200 20.3% 282,300 $680,100 39.6% 100.0%
Step by Step Solution
3.38 Rating (179 Votes )
There are 3 Steps involved in it
Req 1 Ottos Auto Sales CommonSize Income Statement Compared to Industry Average Year Ended December ... View full answer

Get step-by-step solutions from verified subject matter experts
Document Format (3 attachments)
1350_60b9f89b03dfa_607962.pdf
180 KBs PDF File
1350-B-M-A-I(3638).xlsx
300 KBs Excel File
1350_60b9f89b03dfa_607962.docx
120 KBs Word File