

PolyChem is a large manufacturer of packaging materials for supermarkets and other retail applications; the packages are
Question:
PolyChem is a large manufacturer of packaging materials for supermarkets and other retail applications; the packages are used by customers to carry away their purchases.
PolyChem has succeeded for many years by providing a high-quality product and superior customer service. Recently, additional competitors have entered the market, both local and foreign, and PolyChem is finding that it must increasingly compete on price. PolyChem's strategy for dealing with the increased competition is to market its products to smaller retailers that would appreciate the firm's quality and service, as well as the firm's ability to customize the product-adding different designs and colors to the packaging material. Until recently, the firm determined product costs based on simple averages of materials purchases, plant labor, and overhead. The firm's management is now interested in improving, if possible, the accuracy of its cost information. As a start, Cheryl Greenberg, the management accountant, obtains the following sample of data (Table 1) from the plant manager, showing the machine number, the order size (quantity, in thousands), the machine setup time (in hours per unit; setup time also includes cleanup time after the order is run), run time (the operating time for the machine to produce the order), and a measure of the complexity of the order based on a subjective rating where 1 = less complex and 2 = more complex (complexity relates to the number and type of images and colors printed on the packaging material).
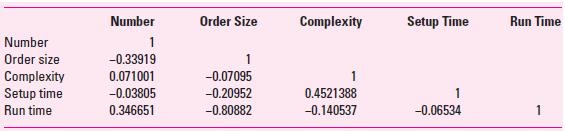
Cheryl wants to run some regression analyses to better understand this data and, as a first step, obtains a correlation analysis which shows the simple correlation between each of the variables in Table 1. The results are shown in Table 2. Cheryl understands that each of the correlation numbers in Table 2 is equivalent to the R - squared for a simple linear regression between the variable, as follows: (correlation between two variables) 2 = the R-squared for simple regression analysis between these two variables. To illustrate, note that the correlation between machine number and order quantity = –.33919. The R-squared for the regression between these two variables (with either as the dependent variable) is (–.33919)2 = .1151. Cheryl also recalls that a negative correlation means that the two variables are inversely related-when one increases, the other decreases.
Table 1 Plant Data for PolyChem
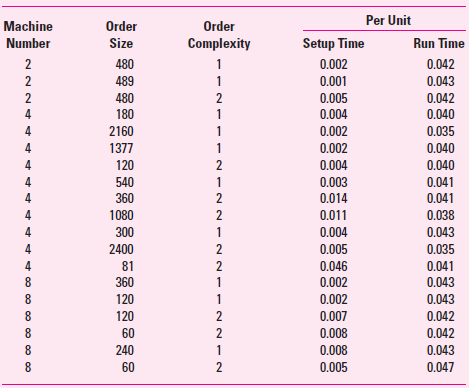
Table 2 Correlation Results for PolyChem’s Plant Data
Required
1. Analyze the findings in Table 2 and assess how, if at all, order size and complexity affect setup time and run time. What other findings in Table 2 are of particular interest?
2. How can your analysis in 1 above help PolyChem become more competitive?
Step by Step Answer:
1 The correlation analysis shows that only one of the correlations is significant at the 005 level o...View the full answer


Cost management a strategic approach
ISBN: 978-0073526942
5th edition
Authors: Edward J. Blocher, David E. Stout, Gary Cokins
