

Question: Presented below is 2009 information for PepsiCo, Inc. and The Coca-Cola Company. Instructions Using the cash-based measures presented in this chapter, compare the (a) Liquidity
Presented below is 2009 information for PepsiCo, Inc. and The Coca-Cola Company.
Instructions
Using the cash-based measures presented in this chapter, compare the
(a) Liquidity
(b) Solvency of the two companies.
Presented below is 2009 information for PepsiCo, Inc. and The Coca-Cola Company.
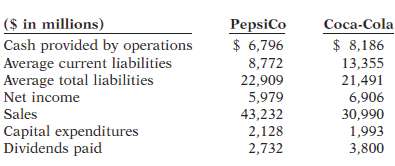
($ in millions) PepsiCo $ 6,796 8,772 22,909 5,979 43,232 2,128 2,732 Coca-Cola $ 8,186 Cash provided by operations Average current liabilities Average total liabilities Net income Sales Capital expenditures Dividends paid 13,355 21,491 6,906 30,990 1,993 3,800
Step by Step Solution
3.29 Rating (155 Votes )
There are 3 Steps involved in it
PepsiCos liquidity is higher better than CocaColas PepsiCos current cash debt coverage ratio is ... View full answer

Get step-by-step solutions from verified subject matter experts
Document Format (1 attachment)
48-B-A-B-S-C-F (268).docx
120 KBs Word File