

Question: Refer to Samsung's balance sheet in Appendix A. How does its cash (titled Cash and cash equivalents) compare with its other current assets (in both
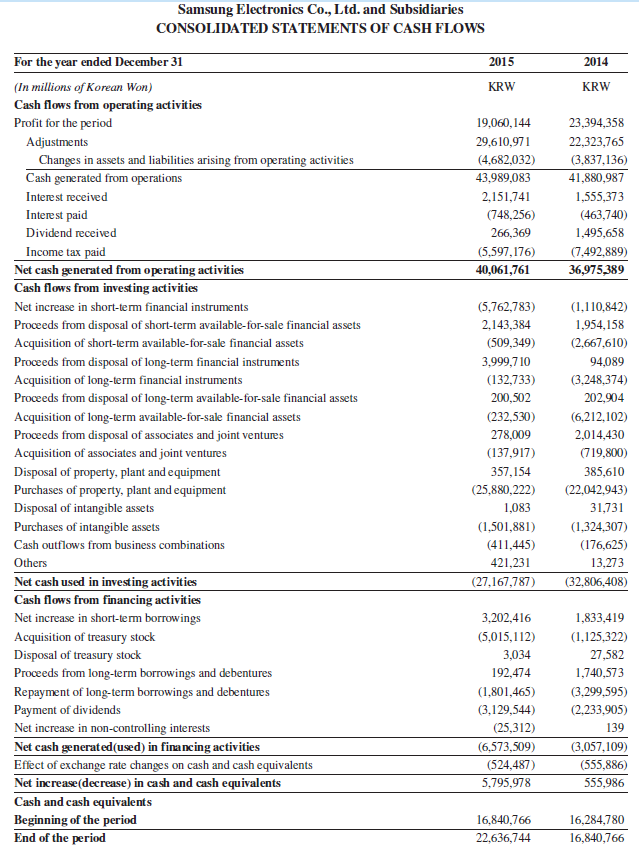
Refer to Samsung's balance sheet in Appendix A. How does its cash (titled "Cash and cash equivalents") compare with its other current assets (in both amount and percent) as of December 31, 2015? Compare and assess its cash at December 31, 2015, with its cash at December 31, 2014.
Samsung's balance sheet from Appendix A
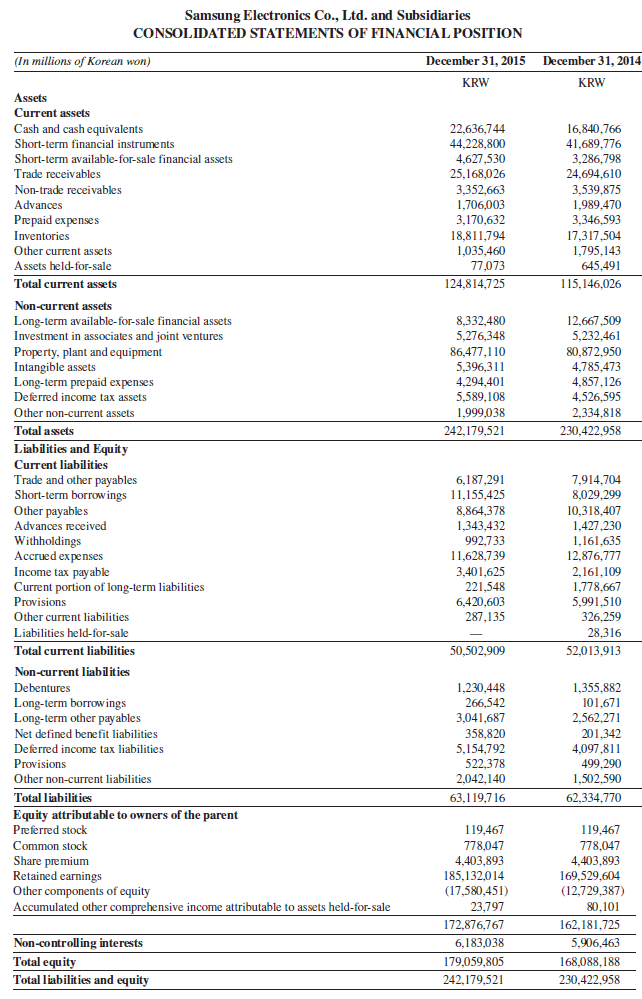
Samsung Electronics Co., Ltd. and Subsidiaries CONSOLIDATED STATEMENTS OF FINANCIAL POSITION December 31, 2015 December 31, 2014 (In millions of Korean won) KRW KRW Assets Current assets 16,840,766 Cash and cash equivalents 22,636,744 44,228,800 4,627,530 Short-term financial instruments 41,689,776 3,286.798 24,694,610 3.539.875 Short-term available-for-sale financial assets Trade receivables 25,168,026 3,352,663 1,706,003 3,170,632 Non-trade recei vables 1,989,470 3,346,593 Advances Prepaid expenses 18,811,794 1,035,460 77,073 Inventories 17,317,504 1,795,143 645,491 Other current assets Assets held-for-sale Total current assets 124,814,725 115,146,026 Non-current assets 12,667,509 5,232,461 Long-term available-for-sale financial assets Investment in associates and joint ventures Property, plant and equipment Intangible assets Long-term prepaid expenses Deferred income tax assets 8,332,480 5,276,348 86,477,110 5,396,311 4,294,401 5,589,108 1,999,038 80,872,950 4,785,473 4,857,126 4,526,595 Other non-current assets 2,334,818 Total assets 242,179,521 230,422,958 Liabilities and Equity Current liabilities Trade and other payables Short-term borrowings 6,187,291 11,155,425 7,914,704 8,029,299 Other payables Advances received 8,864,378 1,343,432 992,733 11,628,739 10,318,407 1,427,230 1,161,635 12,876,777 Withholdings Accrued expenses 3,401,625 221,548 6,420,603 287,135 Income tax payable Current portion of long-term liabilities Provisions 2,161,109 1,778,667 5,991,510 Other current liabilities 326,259 Liabilities held-for-sale 28,316 Total current liabilities 50,502,909 52,013,913 Non-current liabilities Debentures 1,230,448 266,542 3,041,687 1,355,882 101,671 2,562,271 201.342 4,097,811 499,290 1,502,590 Long-term borrowings Long-term other payables Net defined benefit liabilities 358.820 Deferred income tax liabilities 5,154,792 522,378 2,042,140 Provisions Other non-current liabilities 63,119,7 16 62.334.770 Total liabilities Equity attributable to owners of the parent Preferred stock 119,467 778,047 4,403,893 185,132,014 (17,580,451) 119,467 778,047 4,403,893 Common stock Share premium Retained earnings Other components of equity Accumulated other comprehensive income attributable to assets held-for-sale 169,529.604 (12,729,387) 23,797 80,101 172,876.767 162,181,725 Non-controlling interests 6,183,038 5,906,463 Total equity 179,059,805 168,088,188 Total liabilities and equity 242,179,521 230,422,958 |||||
Step by Step Solution
3.45 Rating (158 Votes )
There are 3 Steps involved in it
Samsungs cash and cash equivalents at December 31 2015 equals 22636744 all in ... View full answer

Get step-by-step solutions from verified subject matter experts
Document Format (1 attachment)
1203-B-C-A-P-A-C(182).docx
120 KBs Word File