

Question: Refer to the data in the preceding exercise. Draw diagrams depicting the direct-material and direct-labor variances similar to the diagrams in Exhibits (a) and (b).
Refer to the data in the preceding exercise. Draw diagrams depicting the direct-material and direct-labor variances similar to the diagrams in Exhibits (a) and (b).
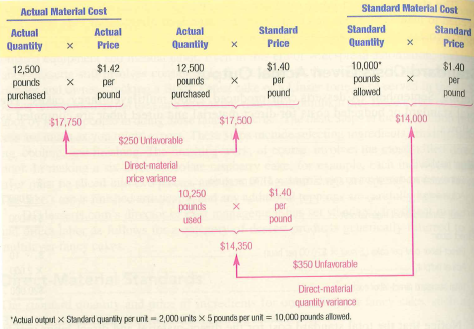
(a)
(b)
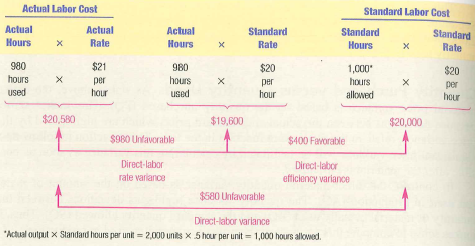
Actual Labor Cost Standard Labor Cost Actual Standard Standard Hours Rate Hours x Rate $20 hour x 980 hoursX used $21 x per hour 980 hours X used $20 per hour 1,000 hoUrs allowed 20,580 $19,600 $20,000 $980 Unavorabla $400 Faworabie Direct-labor rate varlance Direct-labor efficiency variance $580 Unfavorable Direct-labor variance Actual output x Standard hours per unit 2,000 units x 5 hour per unit-1,000 hours allowed
Step by Step Solution
3.55 Rating (172 Votes )
There are 3 Steps involved in it
a b ACTUAL MATERIAL Actual Quantity COST x DIRECTMATERIAL PRICE AND QUANTITY VARIANCES 60... View full answer

Get step-by-step solutions from verified subject matter experts
Document Format (1 attachment)
238-B-M-A-S-C (862).docx
120 KBs Word File