

Question: Refer to the data in the preceding exercise. Use diagrams similar to those in Exhibits (a) and (b) to compute the variable-overhead spending and efficiency
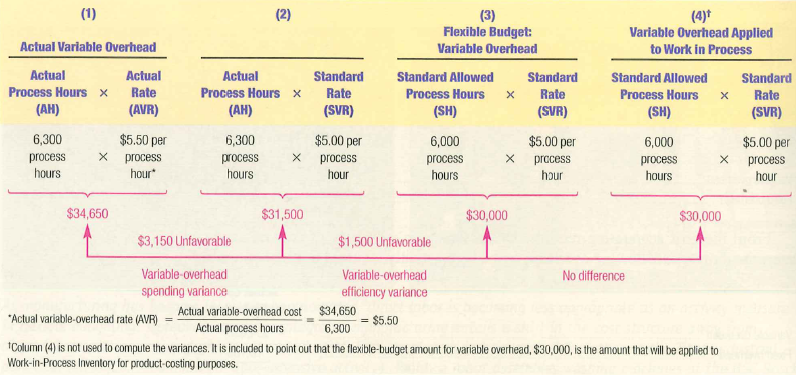
Refer to the data in the preceding exercise. Use diagrams similar to those in Exhibits (a) and (b) to compute the variable-overhead spending and efficiency variances, and the fixed overhead budget and volume variances.
(a)
(b)
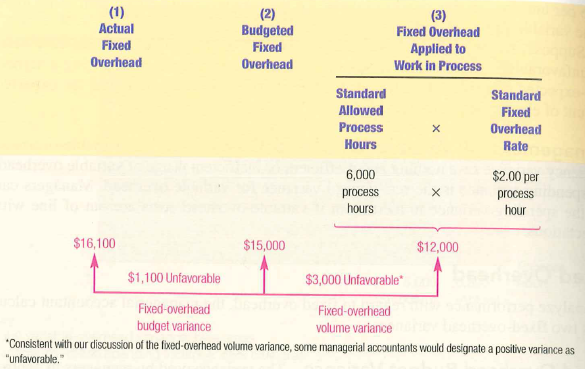
Actual Fixed Overhead Budgeted Fixed Overhead Fixed Overhead Applied to Work in Process Standard Allowed Process Hours Standard Fixed Overhead Rate 6,000 process hours $2.00 per process hour $16,100 $15,000 $12,000 $1,100 Unfavorable $3,000 Unfavorable* Fixed-overhead budget variance Fixed-overhead volume variance Consistent with our discussion of the fxed-overhead volume variance, some managerial accountants would designate a positive variance as
Step by Step Solution
3.39 Rating (155 Votes )
There are 3 Steps involved in it
a Variable overhead variance Actual variableoverhead rate AVR Column 4 is not used to compute the va... View full answer

Get step-by-step solutions from verified subject matter experts
Document Format (1 attachment)
238-B-M-A-F-B (325).docx
120 KBs Word File