

Question: Refer to the data set in Table 2.16. a. Prepare a scatter diagram to show the relationship between the variables Profit and Stockholders' Equity. b.
Refer to the data set in Table 2.16.
a. Prepare a scatter diagram to show the relationship between the variables Profit and Stockholders' Equity.
b. Comment on any relationship between the variables.
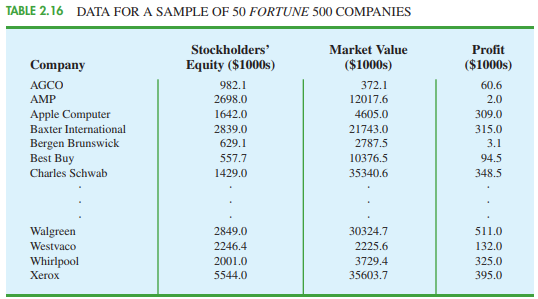
TABLE 2.16 DATA FOR A SAMPLE OF 50 FORTUNE 500 COMPANIES Stockholders' Market Value Profit ($1000s) ($1000s) Company Equity ($1000s) AGCO 982.1 372.1 60.6 AMP 2698.0 12017.6 2.0 Apple Computer Baxter International Bergen Brunswick Best Buy 1642.0 4605.0 309.0 2839.0 21743.0 315.0 629.1 2787.5 3.1 557.7 10376.5 94.5 Charles Schwab 1429.0 35340.6 348.5 Walgreen 2849 30324.7 511.0 Westvaco 2246.4 2225.6 132.0 Whirlpool 2001.0 3729.4 325.0 5544.0 35603.7 395.0
Step by Step Solution
3.48 Rating (168 Votes )
There are 3 Steps involved in it
a Scatter diagram of Profit vs Stockholders Equity ... View full answer

Get step-by-step solutions from verified subject matter experts
Document Format (1 attachment)
1156-M-S-P(10230).docx
120 KBs Word File