Question:
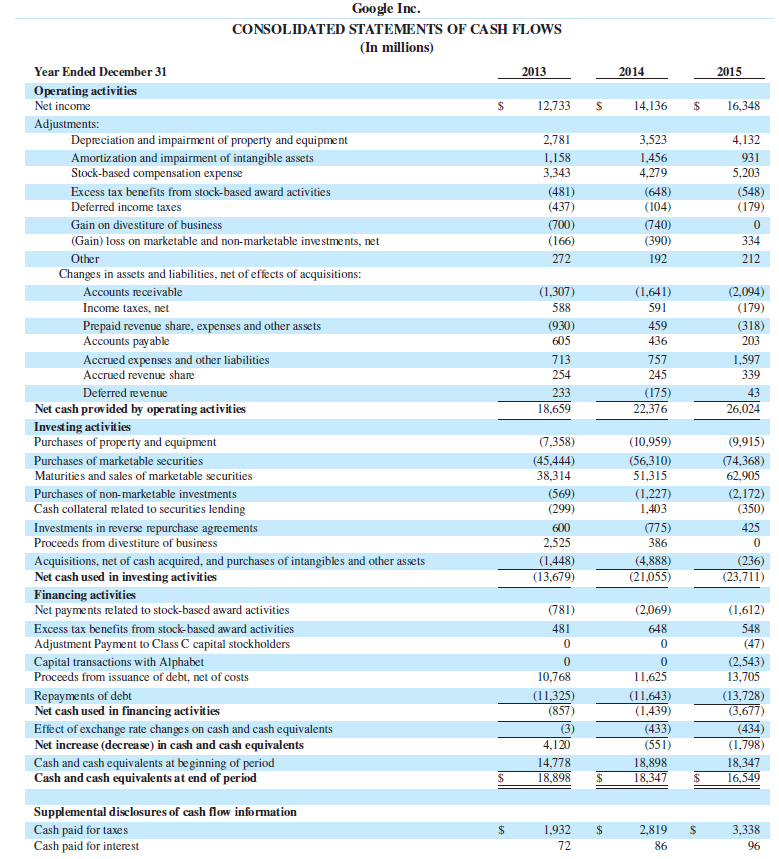
Refer to the statement of cash flows for Google in Appendix A for the fiscal year ended December 31, 2015, to answer the following.
1. What amount of cash is used to purchase property and equipment?
2. How much depreciation and impairment of property and equipment are recorded?
3. What total amount of net cash is used in investing activities?
Google's financial statements from Appendix A.
Financial Statements
Financial statements are the standardized formats to present the financial information related to a business or an organization for its users. Financial statements contain the historical information as well as current period’s financial...
Transcribed Image Text:
Google Inc. CONSOLIDATED BALANCE SHEETS (In millions, except share and par value amounts which are reflected in thousands, and par value per share amounts) As of December 31 2014 2015 Assets Current assets 16,549 56,517 Cash and cash equivalents 18,347 %24 Marketable securities 46,048 Total cash, cash equivalents, and marketable securities (including securities loaned of $4,058 and $4,531) 64,395 73,066 9,383 Accounts receivable, net of allowance of $225 and $296 11,556 Receivable under re verse repurchase agreements Income taxes receivable, net 875 450 591 1,903 Prepaid revenue share, expenses and other assets Total current assets 3,412 78,656 3,139 90,114 Prepaid revenue share, expenses and other assets, non-current Non-marketable investments 3,187 3,079 3,181 5,183 Deferred income taxes 176 251 Property and equipment, net Intangible assets, net 23,883 29,016 4,607 3,847 15,869 Goodwill 15,599 147,461 Total assets 129,187 Liabilities and Stockholders’ Equity Current liabilities Accounts payable 24 1,715 1,931 Short-term debt 2,009 3,069 3,225 3,539 Accrued compensation and benefits 4,768 2,329 Accrued expenses and other current liabilities Accrued revenue share 4,408 1,952 Securities lending payable 2,778 2,428 788 Deferred revenue 752 Income taxes payable, net 96 302 16,779 19,310 Total current liabilities Long-term debt Deferred revenue, non-current 1,995 3,228 104 151 3,340 3,663 Income taxes payable, non-current Deferred income taxes 758 189 Other long-term liabilities Commitments and contingencies (Note 11) 1,118 1,822 Stockholders' equity: Convertible preferred stock, $0.001 par value per share; 100,000 shares authorized, no shares issued and outstanding; 0.5 shares authorized, no shares issued and outstanding Class A and Class B common stock, and Class C capital stock and additional paid-in capital, S0.001 par value per share: 15,000,000 shares authorized (Class A 9,000,000, Class B 3,000,000, Class C 3,000,000); 680,172 (Class A 286,560, Class B 53,213, Class C 340,399), and par value of $680 (Class A $287, Class B $53, Class C $340); and 1.5 shares authorized (Class A 0.5, Class B 0.5, Class C0.5); 0.3 (Class A 0.1, Class B 0.1, Class CO.1), and par value of $0, shares issued and outstanding Accumulated other comprehensive income (loss) Retained earnings Total stockholders' equity Total liabilities and stockholders' equity 28,767 31,313 (1,874) 27 75,066 90,892 103,860 120,331 129,187 147,461 2$