

Researchers at Miami University in Oxford, Ohio, investigated the use of p charts to monitor the market
Question:
Researchers at Miami University in Oxford, Ohio, investigated the use of p charts to monitor the market share of a product and to document the effectiveness of marketing promotions. Market share is defined as the company’s proportion of the total number of products sold in a category. If a p chart based on a company’s market share indicates an in control process, then the company’s share in the marketplace is deemed to be stable and consistent over time. In the example given in the article, the RudyBird Disk Company collected daily sales data from a nationwide retail audit service. The first 30 days of data in the accompanying table (stored in RudyBird) indicate the total number of cases of computer disks sold and the number of RudyBird disks sold. The final 7 days of data were taken after RudyBird launched a major in store promotion. A control chart was used to see if the in store promotion would result in special cause variation in the marketplace.
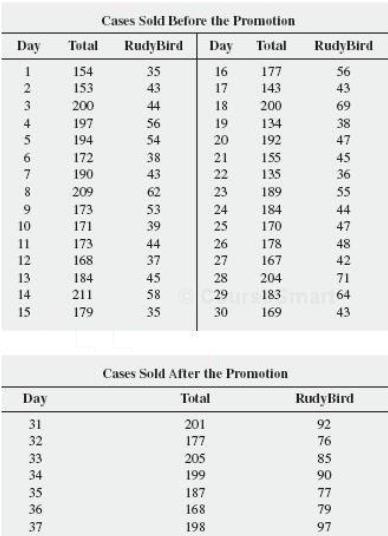
a. Construct a p chart, using data from the first 30 days (prior to the promotion) to monitor the market share for RudyBird disks.
b. Is the market share for RudyBird in control before the start of the in store promotion?
c. On your control chart, extend the control limits generated in (b) and plot the proportions for days 31 through 37. What effect, if any, did the in store promotion have on RudyBird’s market share?
Step by Step Answer:
a b Yes RudyBirds market share is in control before the start ...View the full answer


Business Statistics A First Course
ISBN: 9780321979018
7th Edition
Authors: David M. Levine, Kathryn A. Szabat, David F. Stephan
