

Question: Revenue and expense data for the current calendar year for Sorenson Electronics Company and for the electronics industry are as follows. The Sorenson Electronics Company
Revenue and expense data for the current calendar year for Sorenson Electronics Company and for the electronics industry are as follows. The Sorenson Electronics Company data are expressed in dollars. The electronics industry averages are expressed in percentages.
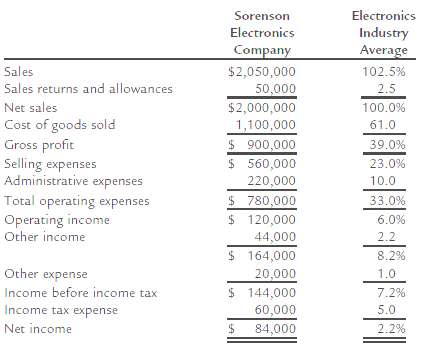
a. Prepare a common-sized income statement comparing the results of operations for Sorenson Electronics Company with the industry average. Round to one decimal place.b. As far as the data permit, comment on significant relationships revealed by thecomparisons.
Electronics Industry Average Sorenson Electronics Company Sales $2,050,000 102.5% Sales returns and allowances 50,000 2.5 Net sales $2,000,000 100.0% Cost of goods sold Gross profit Selling expenses Administrative expenses Total operating expenses Operating income Other income 1,100,000 61.0 $ 900,000 $ 560,000 39.0% 23.0% 220,000 10.0 $ 780,000 $ 120,000 44,000 $ 164,000 20,000 $ 144,000 60,000 33.0% 6.0% 2.2 8.2% Other expense Income before income tax 1.0 7.2% Income tax expense 5.0 Net income 84,000 2.2%
Step by Step Solution
3.46 Rating (166 Votes )
There are 3 Steps involved in it
a b The cost of goods sold is 6 percentage points lower than the industry average but the selling ex... View full answer

Get step-by-step solutions from verified subject matter experts
Document Format (1 attachment)
59-B-M-A-F-S-A (79).docx
120 KBs Word File