

Question: Richard Ellis, the director of cost operations of American Micro Devices, wishes to develop an accurate cost function to explain and predict support costs in
Richard Ellis, the director of cost operations of American Micro Devices, wishes to develop an accurate cost function to explain and predict support costs in the company’s printed circuit board assembly operation. Mr. Ellis is concerned that the cost function that he currently uses—based on direct labor costs—is not accurate enough for proper planning and control of support costs.
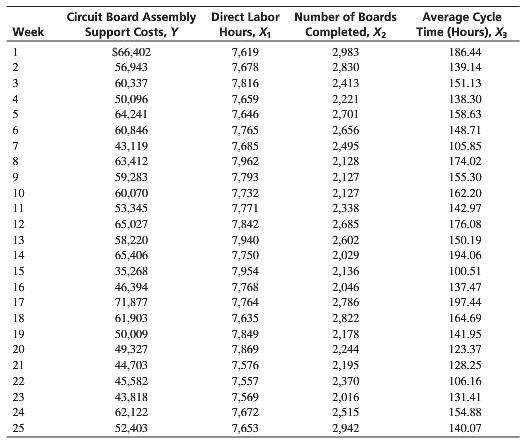
Mr. Ellis directed one of his financial analysts to obtain a random sample of 25 weeks of support costs and three possible cost drivers in the circuit-board assembly department: direct labor hours, number of boards assembled, and average cycle time of boards assembled. (Average cycle time is the average time between start and certified completion—after quality testing—of boards assembled during a week.) Much of the effort in this assembly operation is devoted to testing for quality and reworking defective boards, all of which increase the average cycle time in any period. Therefore, Mr. Ellis believes that average cycle time will be the best support-cost driver. Mr. Ellis wants his analyst to use regression analysis to demonstrate which cost driver best explains support costs.
1. Plot support costs, Y, versus each of the possible cost drivers, X1, X2, and X3.
2. Use regression analysis to measure cost functions using each of the cost drivers.
3. According to the criteria of plausibility and reliability, which is the best cost driver for support costs in the circuit board assembly department?
4. Interpret the economic meaning of the best cost function.
Circuit Board Assembly Direct Labor Number of Boards Hours, X, Completed, X2 Average Cycle Time (Hours), X3 Week Support Costs, Y 1 2,983 S66,402 56,943 7,619 186.44 7,678 2,830 139.14 60,337 7,816 2,413 151.13 4 7,659 50,096 64,241 2,221 2,701 138.30 7,646 158.63 6. 4 7,765 2,656 148.71 7 105.85 43,119 63,412 7,685 2,495 2,128 8 7,962 7,793 174.02 9 59,283 2,127 155.30 10 60,070 53,345 65,027 7,732 7,771 2,127 2,338 162.20 11 142.97 12 7,842 7,940 2,685 176.08 13 58,220 65,406 2,602 2,029 150.19 14 7,750 194.06 15 35,268 7,954 2,136 100.51 16 46,394 71,877 7,768 2,046 2,786 137.47 17 7,764 197.44 18 61,903 7,635 2,822 164.69 19 50,009 49,327 7,849 2,178 2,244 141.95 20 7,869 123.37 21 44,703 7,576 2,195 128.25 22 45,582 7,557 2,370 106.16 23 43,818 62,122 7,569 2,016 2,515 131.41 24 7,672 154.88 25 52,403 7,653 2,942 140.07
Step by Step Solution
3.38 Rating (167 Votes )
There are 3 Steps involved in it
1 The three graphs are as follows 2 This output is generated by a spreadsheet Regressions of circuit board support costs using the following as cost d... View full answer

Get step-by-step solutions from verified subject matter experts
Document Format (1 attachment)
345-B-M-A-D-M (1529).docx
120 KBs Word File