

Question: 4.15 Figure 4.8 is a scatterplot of tree frog mating-call frequency (in notes per second) against outside temperature (in degrees Celsius, C ) for 16
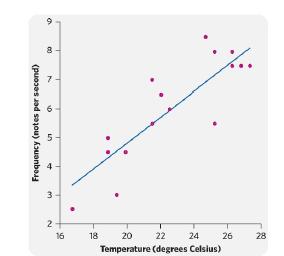
4.15 Figure 4.8 is a scatterplot of tree frog mating-call frequency (in notes per second) against outside temperature (in degrees Celsius, °C ) for 16 American bird-voiced tree frogs.14 The line is the least-squares regression line for predicting call frequency from temperature. If another frog of this species initiates a mating call when the outside temperature is 24°C , you predict the call frequency (in notes/s) to be close to
a. 5.
b. 7.
c. 9.
4.16 The slope of the line in Figure 4.8 is closest to (in notes/s/° C)
a. –0.5
b. 0.
c. 0.5.
9 00 A Frequency (notes per second) 23 + 3- 24 26 28 Temperature (degrees Celsius) 2 16 18 20 22
Step by Step Solution
There are 3 Steps involved in it

Get step-by-step solutions from verified subject matter experts