

Consider the graphical model in Figure 15.27. Argue that if the demand curve fails to shift significantly
Question:
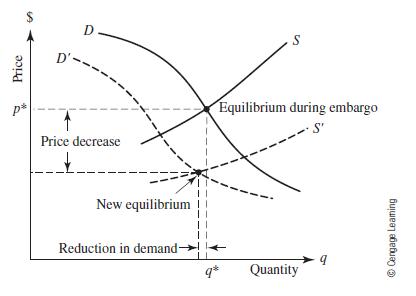
Consider the graphical model in Figure 15.27. Argue that if the demand curve fails to shift significantly to the left, an increase in the equilibrium quantity could occur after the crisis.
Figure 15.27
Fantastic news! We've Found the answer you've been seeking!
Step by Step Answer:
The graphical model provided represents a typical supply and demand curve scenario in the context of an event such as an embargo In this economic mode...View the full answer

Answered By
John Kimutai
I seek to use my competencies gained through on the job experience and skills learned in training to carry out tasks to the satisfaction of users. I have a keen interest in always delivering excellent work
11+ Reviews
24+ Question Solved
Related Book For 

A First Course In Mathematical Modeling
ISBN: 9781285050904
5th Edition
Authors: Frank R. Giordano, William P. Fox, Steven B. Horton
Question Posted:
