

Question: Problem 6 in Section 3.1 Data from problem 6 The following data represent (hypothetical) energy consumption normalized to the year1900. Plot the data. Test the
Problem 6 in Section 3.1
Data from problem 6
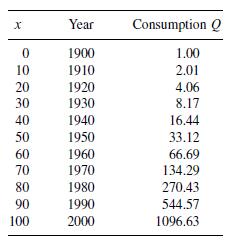
The following data represent (hypothetical) energy consumption normalized to the year1900. Plot the data. Test the model Q=aebx by plotting the transformed data. Estimate the parameters of the model graphically.
For Problems 1-6, find a model using the least-squares criterion either on the data or on the transformed data (as appropriate). Compare your results with the graphical fits obtained in the problem set 3.1 by computing the deviations, the maximum absolute deviation, and the sum of the squared deviations for each model. Find a bound on cmax if the model was fit using the least-squares criterion.
X 0 10 20 30 40 50 60 70 80 90 100 Year 1900 1910 1920 1930 1940 1950 1960 1970 1980 1990 2000 Consumption Q 1.00 2.01 4.06 8.17 16.44 33.12 66.69 134.29 270.43 544.57 1096.63
Step by Step Solution
3.48 Rating (155 Votes )
There are 3 Steps involved in it
Qaex so In Q In a bx Le... View full answer

Get step-by-step solutions from verified subject matter experts