

Suppose the spotted owls' primary food source is a single prey: mice. An ecologist wishes to predict
Question:
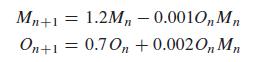
Suppose the spotted owls' primary food source is a single prey: mice. An ecologist wishes to predict the population levels of spotted owls and mice in a wildlife sanctuary. Letting Mn represent the mouse population after n years and on the predator owl population, the ecologist has suggested the model.
The ecologist wants to know whether the two species can coexist in the habitat and whether the outcome is sensitive to the starting populations. Find the equilibrium values of the dynamical system for this predator-prey model.
a. Compare the signs of the coefficients of the preceding model with the signs of the coefficients of the owl's hawks' model in Example.3. Explain the sign of each of the four coefficients 1.2 –0.001, 0.7, and 0.002 in terms of the predator prey relationship being modeled.
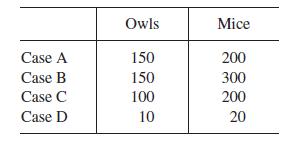
b. Test the initial populations in the following table and predict the long-term outcome:
c. Now experiment with different values for the coefficients using the starting values given. Then try different starting values. What is the long-term behavior? Do your experimental results indicate that the model is sensitive to the coefficients? Is it sensitive to the starting values?
Data from example 3
Suppose a species of spotted owls competes for survival in a habitat that also supports hawks. Suppose also that in the absence of the other species, each individual species exhibits unconstrained growth in which the change in the population during an interval of time (such as 1 day) is proportional to the population size at the beginning of the interval. If on represents the size of the spotted owl population at the end of day n and Hn represents the
competing hawk population, then:
![]()
Here, k1 and k2 are the constant positive growth rates. The effect of the presence of the second species is to diminish the growth rate of the other species, and vice versa. Although there are many ways to model the mutually detrimental interaction of the two species, we will assume that this decrease is approximately proportional to the number of possible interactions between the two species. Therefore, one sub model is to assume that the decrease is proportional to the product of On and Hn. These considerations are modeled by the equations:
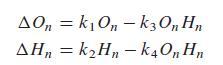
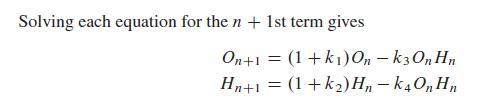
where k1–k4 are positive constants. Now, let's choose specific values for the constants of proportionality and consider the system:
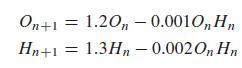
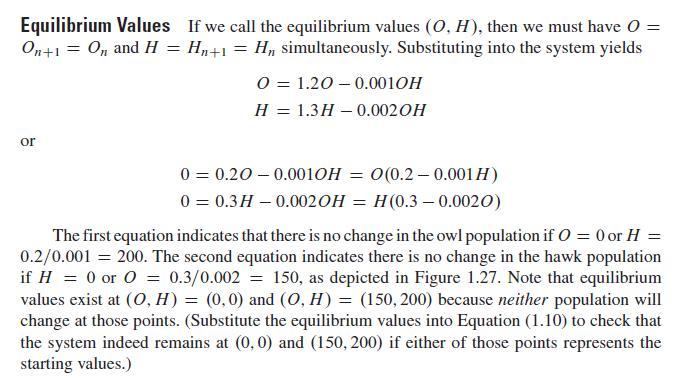
Figure 1.27
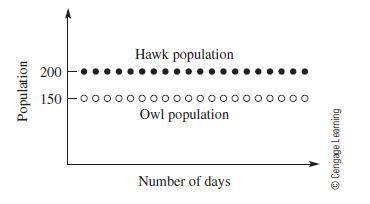
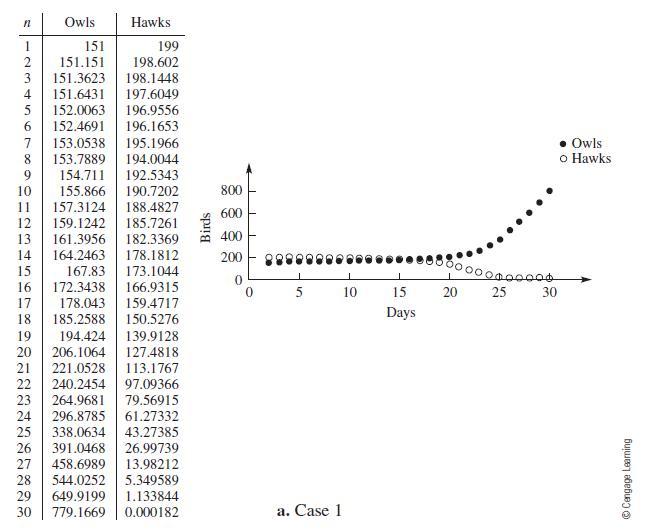
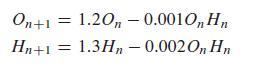
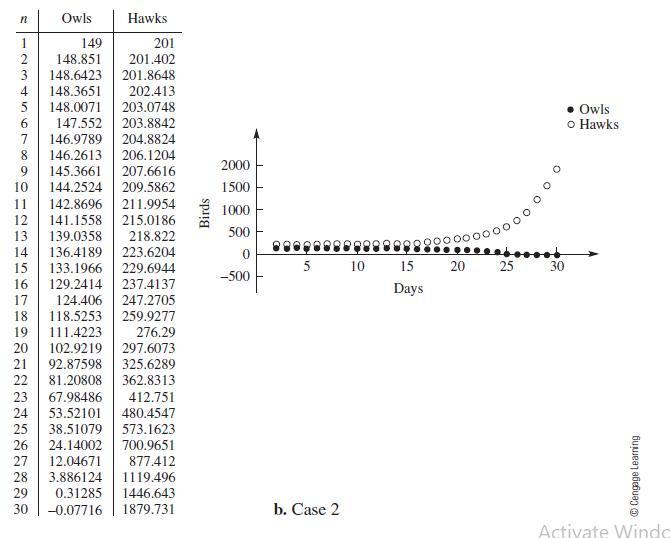
Nowlet's analyze what happens in the vicinity of the equilibrium values we have found. Let's build numerical solutions for the three starting populations given here. Note that the first two values are close to the equilibrium value .150; 200/, whereas the third is near the origin.
Iterating Equation (1.10), beginning with the starting values given, results in the numerical solutions shown in Figure 1.28. Note that in each case, one of the two species eventually drives the other to extinction.
Figure 1.28
Sensitivity to Initial Conditions and Long-Term Behavior Suppose 350 owls and hawks are to be placed in a habitat modeled by Equation (1.10). If 150 of the birds are owls, our model predicts the owls will remain at 150 forever. If 1 owl is removed from the habitat (leaving 149), then the model predicts that the owl population will die out. If 151 owls are placed in the habitat, however, the model predicts that the owls will grow without bound and the hawks will disappear. This model is extremely sensitive to the initial conditions. The equilibrium values are unstable in the sense that if we start close to either equilibrium value, we do not remain close. Note how the model predicts that coexistence of the two species in a single habitat is highly unlikely because one of the two species will eventually dominate the habitat. In the problem set, you are asked to explore this system further by examining other starting points and by changing the coefficients of the
model.
Equation 1.10
Step by Step Answer:
ab and ...View the full answer


A First Course In Mathematical Modeling
ISBN: 9781285050904
5th Edition
Authors: Frank R. Giordano, William P. Fox, Steven B. Horton
