

The data in the accompanying table show the speed n (in increments of 5 mph) of an
Question:
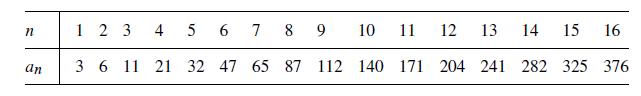
The data in the accompanying table show the speed n (in increments of 5 mph) of an automobile and the associated distance an in feet required to stop it once the brakes are applied. For instance, n = 6 (representing 6 × 5 = 30 mph) requires a stopping distance of a6 = 47 ft.
a. Calculate and plot the changeΔan versus n. Does the graph reasonably approximate a linear relationship?
b. Based on your conclusions in part (a), find a difference equation model for the stopping distance data. Test your model by plotting the errors in the predicted values against n. Discuss the appropriateness of the model.
Fantastic news! We've Found the answer you've been seeking!
Step by Step Answer:
Lets start by calculating the change a n for each speed n and examining i...View the full answer

Answered By
JAPHETH KOGEI
Hi there. I'm here to assist you to score the highest marks on your assignments and homework. My areas of specialisation are:
Auditing, Financial Accounting, Macroeconomics, Monetary-economics, Business-administration, Advanced-accounting, Corporate Finance, Professional-accounting-ethics, Corporate governance, Financial-risk-analysis, Financial-budgeting, Corporate-social-responsibility, Statistics, Business management, logic, Critical thinking,
So, I look forward to helping you solve your academic problem.
I enjoy teaching and tutoring university and high school students. During my free time, I also read books on motivation, leadership, comedy, emotional intelligence, critical thinking, nature, human nature, innovation, persuasion, performance, negotiations, goals, power, time management, wealth, debates, sales, and finance. Additionally, I am a panellist on an FM radio program on Sunday mornings where we discuss current affairs.
I travel three times a year either to the USA, Europe and around Africa.
As a university student in the USA, I enjoyed interacting with people from different cultures and ethnic groups. Together with friends, we travelled widely in the USA and in Europe (UK, France, Denmark, Germany, Turkey, etc).
So, I look forward to tutoring you. I believe that it will be exciting to meet them.
2+ Reviews
10+ Question Solved
Related Book For 

A First Course In Mathematical Modeling
ISBN: 9781285050904
5th Edition
Authors: Frank R. Giordano, William P. Fox, Steven B. Horton
Question Posted:
