

Use linear regression to formulate and analyze Projects 1-5 in Section 2.3. Data from project 1 In
Question:
Use linear regression to formulate and analyze Projects 1-5 in Section 2.3.
Data from project 1
In the TV show Superstars the top athletes from various sports compete against one another in a variety of events. The athletes vary considerably in height and weight. To compensate for this in the weight-lifting competition, the body weight of the athlete is subtracted from his lift. What kind of relationship does this suggest? Use the following table, which displays the winning lifts at the 1996 Olympic Games, to show this relationship.
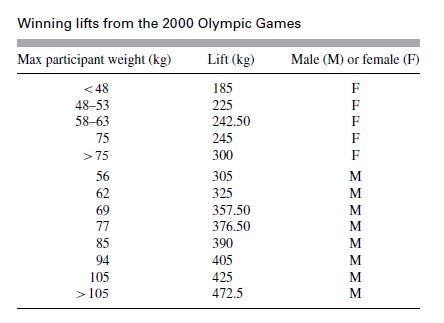
Physiological arguments have been proposed that suggest that the strength of a muscle is proportional to its cross-sectional area. Using this submodel for strength, construct a model relating lifting ability and body weight. List all assumptions. Do you have to assume that all weight lifters are geometrically similar? Test your model with the data provided.
Now consider a refinement to the previous model. Suppose there is a certain amount of body weight that is independent of size in adults. Suggest a model that incorporates this refinement and test it against the data provided. Criticize the use of the preceding data. What data would you really like to have to handicap the weightlifters? Who is the best weightlifter according to your models? Suggest a rule of thumb for the Superstars show to handicap the weightlifters.
Data from project 2
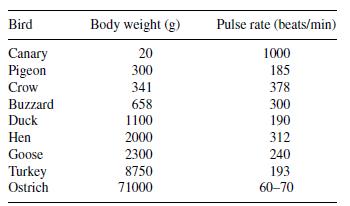
Warm-blooded animals use large quantities of energy to maintain body temperature because of the heat loss through the body surface. In fact, biologists believe that the primary energy drain on a resting warm-blooded animal is maintenance of body temperature.
Data from project 3
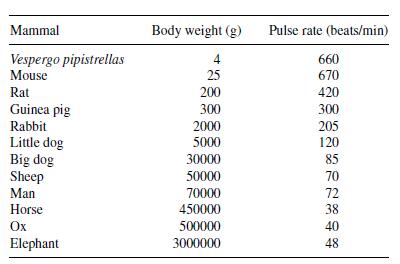
The following data relate the weights of some mammals to their heart rate in beats per minute. Based on the discussion relating blood ow through the heart to body weight, as presented in Project 2, construct a model that relates heart rate to body weight. Discuss the assumptions of your model. Use the data to check your model.
Data from project 4
Lumber cutters wish to use readily available measurements to estimate the number of board feet of lumber in a tree. Assume they measure the diameter of the tree in inches at waist height. Develop a model that predicts board feet as a function of diameter in inches. Use the following data for your test.
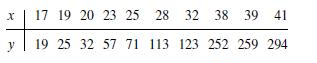
The variable x is the diameter of a ponderosa pine in inches, and y is the number of board feet divided by 10.
Data from project 5
If you have been to a rowing regatta, you may have observed that the more oarsmen there are in a boat, the faster the boat travels. Investigate whether there is a mathematical relationship between the speed of a boat and the number of crew members. Consider the following assumptions (partial list) in formulating a model.
Step by Step Answer:


A First Course In Mathematical Modeling
ISBN: 9781285050904
5th Edition
Authors: Frank R. Giordano, William P. Fox, Steven B. Horton
