

Consider the graph, which shows the U.S. population in 2000 and the projected U.S. population in 2050.
Question:
Consider the graph, which shows the U.S. population in 2000 and the projected U.S. population in 2050.
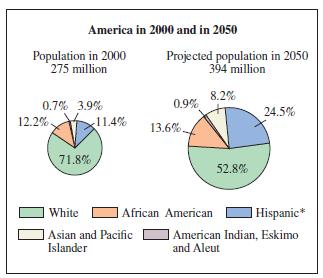
a) Compute the projected percent increase in population from 2000 to 2050 by using the formula given.
b) Measure the radius and then compute the area of the circle representing 2000. Use A = πr2.
c) Repeat part (b) for the circle representing 2050.
d) Compute the percent increase in the size of the area of the circle from 2000 to 2050.
e) Are the circle graphs misleading?
Fantastic news! We've Found the answer you've been seeking!
Step by Step Answer:
a b c d e Yes the percent increase in the ...View the full answer

Answered By
Susan Juma
I'm available and reachable 24/7. I have high experience in helping students with their assignments, proposals, and dissertations. Most importantly, I'm a professional accountant and I can handle all kinds of accounting and finance problems.
15+ Reviews
45+ Question Solved
Related Book For 

A Survey Of Mathematics With Applications
ISBN: 9780135740460
11th Edition
Authors: Allen R. Angel, Christine D. Abbott, Dennis Runde
Question Posted:
