

The following table shows the consumer price index (CPI) for the years 20132018. a) Determine the linear
Question:
The following table shows the consumer price index (CPI) for the years 2013–2018.
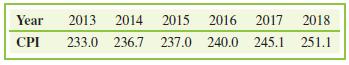
a) Determine the linear correlation coefficient, r, between the year and the CPI.
b) If 2013 is subtracted from each year, the table obtained becomes:
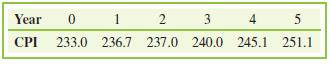
If r is calculated from these values, how will it compare with the r determined in part (a)? Explain.
c) Calculate r from the values in part (b) and compare the results with the value of r determined in part (a). Are they the same? If not, explain why.
Fantastic news! We've Found the answer you've been seeking!
Step by Step Answer:
a b The values should be the same c The values are the same 62908 2243120...View the full answer

Answered By
Shem Ongek
I am a professional who has the highest levels of self-motivation. Additionally, I am always angled at ensuring that my clients get the best of the quality work possible within the deadline. Additionally, I write high quality business papers, generate quality feedback with more focus being on the accounting analysis. I additionally have helped various students here in the past with their research papers which made them move from the C grade to an A-grade. You can trust me 100% with your work and for sure I will handle your papers as if it were my assignment. That is the kind of professionalism that I swore to operate within. I think when rating the quality of my work, 98% of the students I work for always come back with more work which therefore makes me to be just the right person to handle your paper.
174+ Reviews
426+ Question Solved
Related Book For 

A Survey Of Mathematics With Applications
ISBN: 9780135740460
11th Edition
Authors: Allen R. Angel, Christine D. Abbott, Dennis Runde
Question Posted:
