Question:
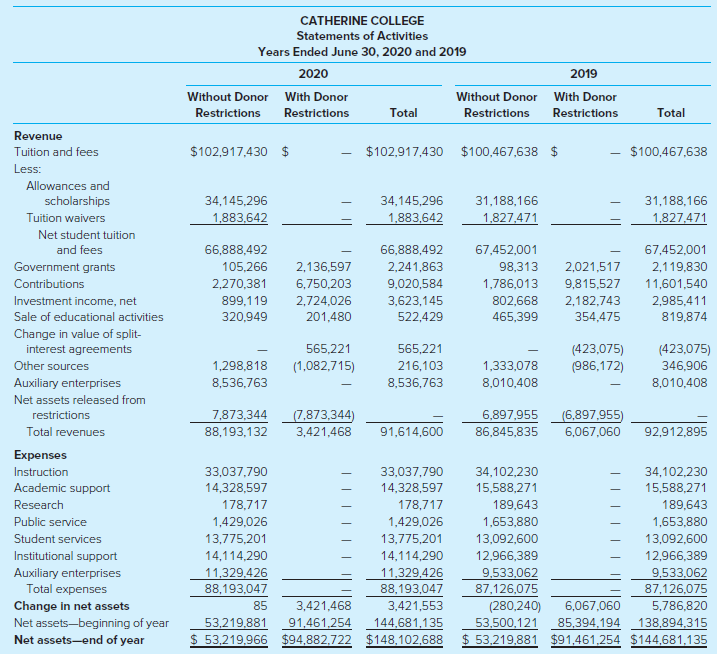
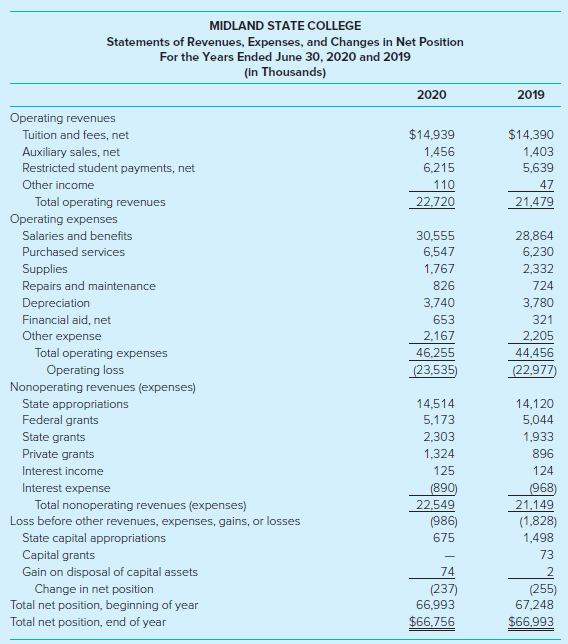
Following are the operating statements for a public and private college. The operating statements have been adapted from the annual reports of a public and a private university. As would be expected, the reports are somewhat different. Catherine College is over 150 years old and has a student enrollment of 5,000. Midland State College is relatively new at 50 years of age and has a student enrollment of 6,704.
Required
a. Identify the reporting standards under which each statement was prepared and identify some of the format differences that are the result of the different reporting standards.
b. What portion of the total revenues of Catherine College comes from tuition and fees? From state appropriations? From grants and contributions? How do those amounts compare to those for Midland State College? Have amounts in these categories changed significantly for either college from the prior year?
c. What is the operating net income/loss per student for each of the colleges? Do the colleges appear to be generating much income per student? Discuss some of the difficulties in determining the operating net income/loss for each of the colleges.
d. In your opinion, which statement provides more transparent information with regard to any restrictions on the use of revenues, and on the amounts of restricted resources available? Provide support for your opinion.
Transcribed Image Text:
CATHERINE COLLEGE Statements of Activities Years Ended June 30, 2020 and 2019 2020 2019 Without Donor With Donor Without Donor With Donor Total Restrictions Restrictions Restrictions Restrictions Total Revenue $102,917,430 $102,917,430 $ $100,467,638 $ $100,467,638 Tuition and fees Less: Allowances and 34,145,296 scholarships 34,145,296 31,188,166 31,188,166 Tuition waivers 1,883,642 1,883,642 1,827,471 1,827,471 Net student tuition 66,888,492 67,452,001 and fees 66,888,492 67,452,001 105,266 98,313 2,021,517 Government grants 2,136,597 2,241,863 2,119,830 9,020,584 Contributions 2,270,381 6,750,203 1,786,013 9,815,527 11,601,540 2,724,026 2,985,411 Investment income, net 899,119 3,623,145 802,668 2,182,743 522,429 Sale of educational activities 320,949 201,480 465,399 354,475 819,874 Change in value of split- 565,221 565,221 (423,075) (986,172) (423,075) 346,906 interest agreements 216,103 Other sources 1,298,818 (1,082,715) 1,333,078 Auxiliary enterprises 8,536,763 8,536,763 8,010,408 8,010,408 Net assets released from 7,873,344 (7,873,344) 6,897,955 (6,897,955) restrictions Total revenues 88,193,132 3,421,468 91,614,600 86,845,835 6,067,060 92,912,895 Expenses Instruction 33,037,790 33,037,790 34,102,230 34,102,230 Academic support 14,328,597 14,328,597 15,588,271 15,588,271 Research 189,643 178,717 178,717 189,643 1,653,880 Public service 1,429,026 1,429,026 1,653,880 13,775,201 Student services 13,775,201 13,092,600 13,092,600 Institutional support 14,114,290 14,114,290 12,966,389 12,966,389 11,329,426 88,193,047 Auxiliary enterprises Total expenses Change in net assets 11,329,426 88,193,047 9,533,062 9,533.062 87,126,075 87,126,075 85 3,421,468 3,421,553 (280,240) 6,067,060 5,786,820 Net assets-beginning of year Net assets-end of year 53,219,881 91,461,254 144,681,135 53,500,121 85,394,194 138,894,315 $ 53,219,881 $91,461,254 $144,681,135 $ 53,219,966 $94,882,722 $148,102,688 MIDLAND STATE COLLEGE Statements of Revenues, Expenses, and Changes in Net Position For the Years Ended June 30, 2020 and 2019 (in Thousands) 2020 2019 Operating revenues Tuition and fees, net $14,939 $14,390 1,456 Auxiliary sales, net Restricted student payments, net 1,403 6,215 5,639 Other income 110 47 Total operating revenues 22,720 21,479 Operating expenses Salaries and benefits 30,555 28,864 Purchased services 6,547 6,230 Supplies 1,767 2,332 Repairs and maintenance 826 724 Depreciation Financial aid, net 3,740 3,780 653 321 Other expense 2,167 2,205 Total operating expenses 46,255 44,456 Operating loss (23,535) (22,977) Nonoperating revenues (expenses) State appropriations Federal grants 14,514 14,120 5,173 5,044 State grants 2,303 1,933 Private grants 1,324 896 Interest income 125 124 (890) 22,549 Interest expense (968) Total nonoperating revenues (expenses) Loss before other revenues, expenses, gains, or losses 21,149 (986) (1,828) State capital appropriations Capital grants 675 1,498 73 Gain on disposal of capital assets 74 Change in net position Total net position, beginning of year Total net position, end of year (237) 66,993 (255) 67,248 $66,756 $66,993