

Question: Objective; Practice graph design principles Required Create bar graphs for each of the following data sets. Follow the principles for graph design presented in the
Objective; Practice graph design principles Required Create bar graphs for each of the following data sets. Follow the principles for graph design presented in the chapter, or explain which rule(s) you violated and why.
a. Sales (in 000s).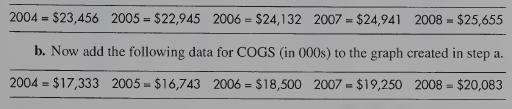
= 2004 $23,456 2005 $22,945 2006 $24,132 2007 = $24,941 2008 $25,655 = b. Now add the following data for COGS (in 000s) to the graph created in step a. 2004 $17,333 2005 $16,743 2006 $18,500 2007 $19,250 2008-$20,083 = =
Step by Step Solution
★★★★★
3.38 Rating (160 Votes )
There are 3 Steps involved in it
1 Expert Approved Answer
Step: 1 Unlock

Question Has Been Solved by an Expert!
Get step-by-step solutions from verified subject matter experts
Step: 2 Unlock
Step: 3 Unlock