

Question: Comparative income statement data for Chen Inc. and Chuan Ltd., two competitors, are shown below for the year ended December 31, 2024 Instructions a. Using
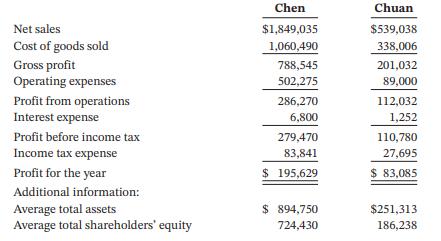
Comparative income statement data for Chen Inc. and Chuan Ltd., two competitors, are shown below for the year ended December 31, 2024
Instructions
a. Using vertical analysis, calculate the percentage of the base amount of the income statement for each company.
b. Calculate the gross profit margin, profit margin, asset turnover, return on assets, and return on equity ratios for 2024 for each company.
c. Using the information calculated in parts (a) and (b), compare the profitability of each company.
d. Is your comparison in part (c) an intracompany comparison or an intercompany comparison? Explain.
How is your assessment of profitability affected by the differing sizes of the two companies, if at all? Explain.
Net sales Cost of goods sold Gross profit Operating expenses Profit from operations Interest expense Profit before income tax Income tax expense Profit for the year Additional information: Average total assets Average total shareholders' equity Chen $1,849,035 1,060,490 788,545 502,275 286,270 6,800 279,470 83,841 $ 195,629 $ 894,750 724,430 Chuan $539,038 338,006 201,032 89,000 112,032 1,252 110,780 27,695 $ 83,085 $251,313 186,238
Step by Step Solution
3.35 Rating (176 Votes )
There are 3 Steps involved in it
a The percentages shown in the above table do not add perfectly because of rounding discrepancies th... View full answer

Get step-by-step solutions from verified subject matter experts