

The line graph shows the enrollment for College R between 1950 and 2000. If enrollment increases by
Question:
The line graph shows the enrollment for College R between 1950 and 2000.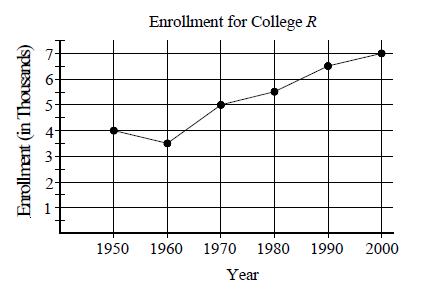 If enrollment increases by approximately the same percentage between 2000 and 2010 as it decreased between 1950 and 1960, what is the expected enrollment in 2010?
A) 7,250
B) 7,540
C) 7,650
D) 7,875
Fantastic news! We've Found the answer you've been seeking!
Step by Step Answer:
D Percent of decrease in enrollment between 1950 number decreased 500 ...View the full answer

Answered By
Carly Cimino
As a tutor, my focus is to help communicate and break down difficult concepts in a way that allows students greater accessibility and comprehension to their course material. I love helping others develop a sense of personal confidence and curiosity, and I'm looking forward to the chance to interact and work with you professionally and better your academic grades.
12+ Reviews
21+ Question Solved
Related Book For 
Question Posted:
