

Question: Data in the following table list the average weekly earnings of U.S. production workers from 2003 to 2013. a) Without using the regression feature on
Data in the following table list the average weekly earnings of U.S. production workers from 2003 to 2013. 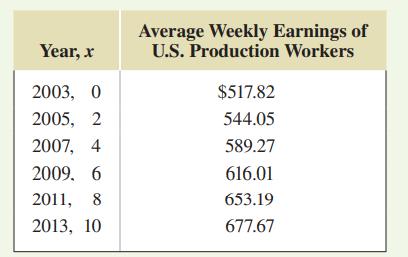
a) Without using the regression feature on a graphing calculator, model the data with a linear function. Then using this function, predict the average weekly earnings of U.S. production workers in 2017. Answers may vary depending on the data points used.
b) Using a graphing calculator, fit a regression line to the data and use it to predict the average weekly earnings of production workers in 2017. What is the correlation coefficient for the regression line?
Year, x 2003, 0 2005, 2 2007, 4 2009. 6 2011, 8 2013, 10 Average Weekly Earnings of U.S. Production Workers $517.82 544.05 589.27 616.01 653.19 677.67
Step by Step Solution
3.39 Rating (165 Votes )
There are 3 Steps involved in it
a To model the data with a linear function we can use the points 0 51782 and 10 67767 to find the sl... View full answer

Get step-by-step solutions from verified subject matter experts