

Question: Explain how each of the following changes will affect a company?s range of earnings chart such as that shown in Figure 6.2. How would each
Explain how each of the following changes will affect a company?s range of earnings chart such as that shown in Figure 6.2. How would each of the changes affect the attractiveness of increased debt financing relative to increased equity financing?
a. An increase in the interest rate on the new debt to be raised.
b. An increase in the company?s stock price.
c. Increased uncertainty about the issuing company?s future earnings.
d. Increased cash dividends paid on common stock.
e. An increase in the amount of debt the company already has outstanding.
Figure 6.2
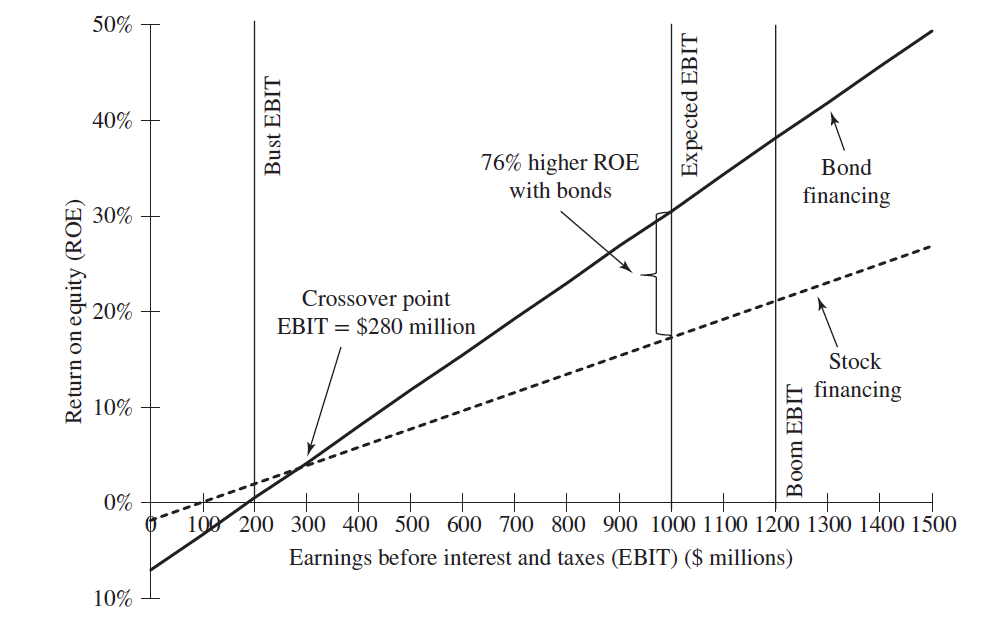
50% 40% 76% higher ROE Bond with bonds financing 30% Crossover point EBIT = $280 million 20% Stock financing 10% 0% 100 200 300 400 500 600 700 800 900 1000 1100 1200 1300 1400 1500 Earnings before interest and taxes (EBIT) ($ millions) 10% Return on equity (ROE) Bust EBIT Expected EBIT Boom EBIT
Step by Step Solution
3.20 Rating (153 Votes )
There are 3 Steps involved in it
n inrese in the interest rte n the new debt t be rised will inrese the interest yments tht need t be mde This wuld led t derese in EBIT Ernings befre ... View full answer

Get step-by-step solutions from verified subject matter experts
Document Format (2 attachments)
1836_61d57f2604a02_826215.pdf
180 KBs PDF File
1836_61d57f2604a02_826215.docx
120 KBs Word File