

Looking at Figure 4.6, describe the trend in gross public equity issues and IPOs in the United
Question:
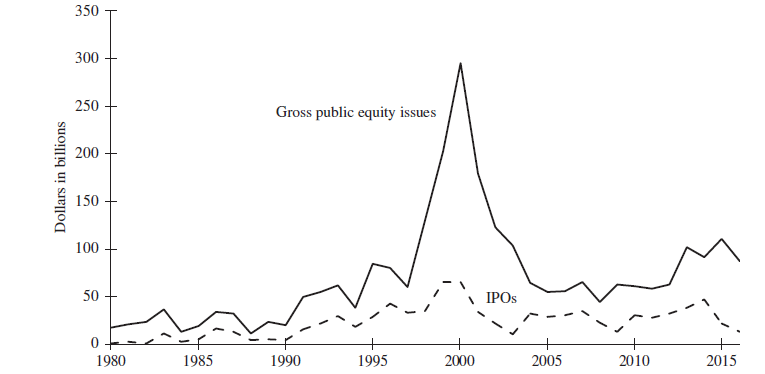
Looking at Figure 4.6, describe the trend in gross public equity issues and IPOs in the United States during the last 35 years. How do you explain this trend given what we observe in Figure 4.5? Explain.
Figure 4.5
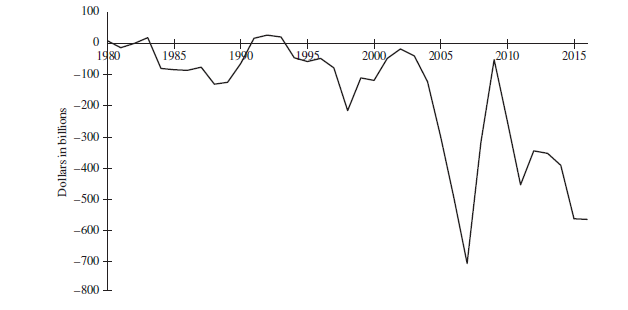
Figure 4.6
Fantastic news! We've Found the answer you've been seeking!
Step by Step Answer:
Although there are periodic ups and downs there is a general upward trend in gross public equit...View the full answer

Answered By
GERALD KAMAU
non-plagiarism work, timely work and A++ work
6+ Reviews
11+ Question Solved
Related Book For 

Question Posted:
